


Most of this guide describes things you can do. This section describes what you can then observe, and it is less than we would like.
That gap is worth stating plainly rather than working around, because the alternative is worse. A team that cannot distinguish "this is unmeasurable" from "we have not figured out how to measure it" will either invent metrics that do not mean anything or abandon work that is producing results it cannot see.
What Search Console will and will not tell you
What you get. The Performance report includes a Search type filter, and switching it to Image gives clicks, impressions, CTR and average position for Google Images specifically. This is the most under-used report in Search Console, and I am sure that plenty of teams have never changed that filter from Web.
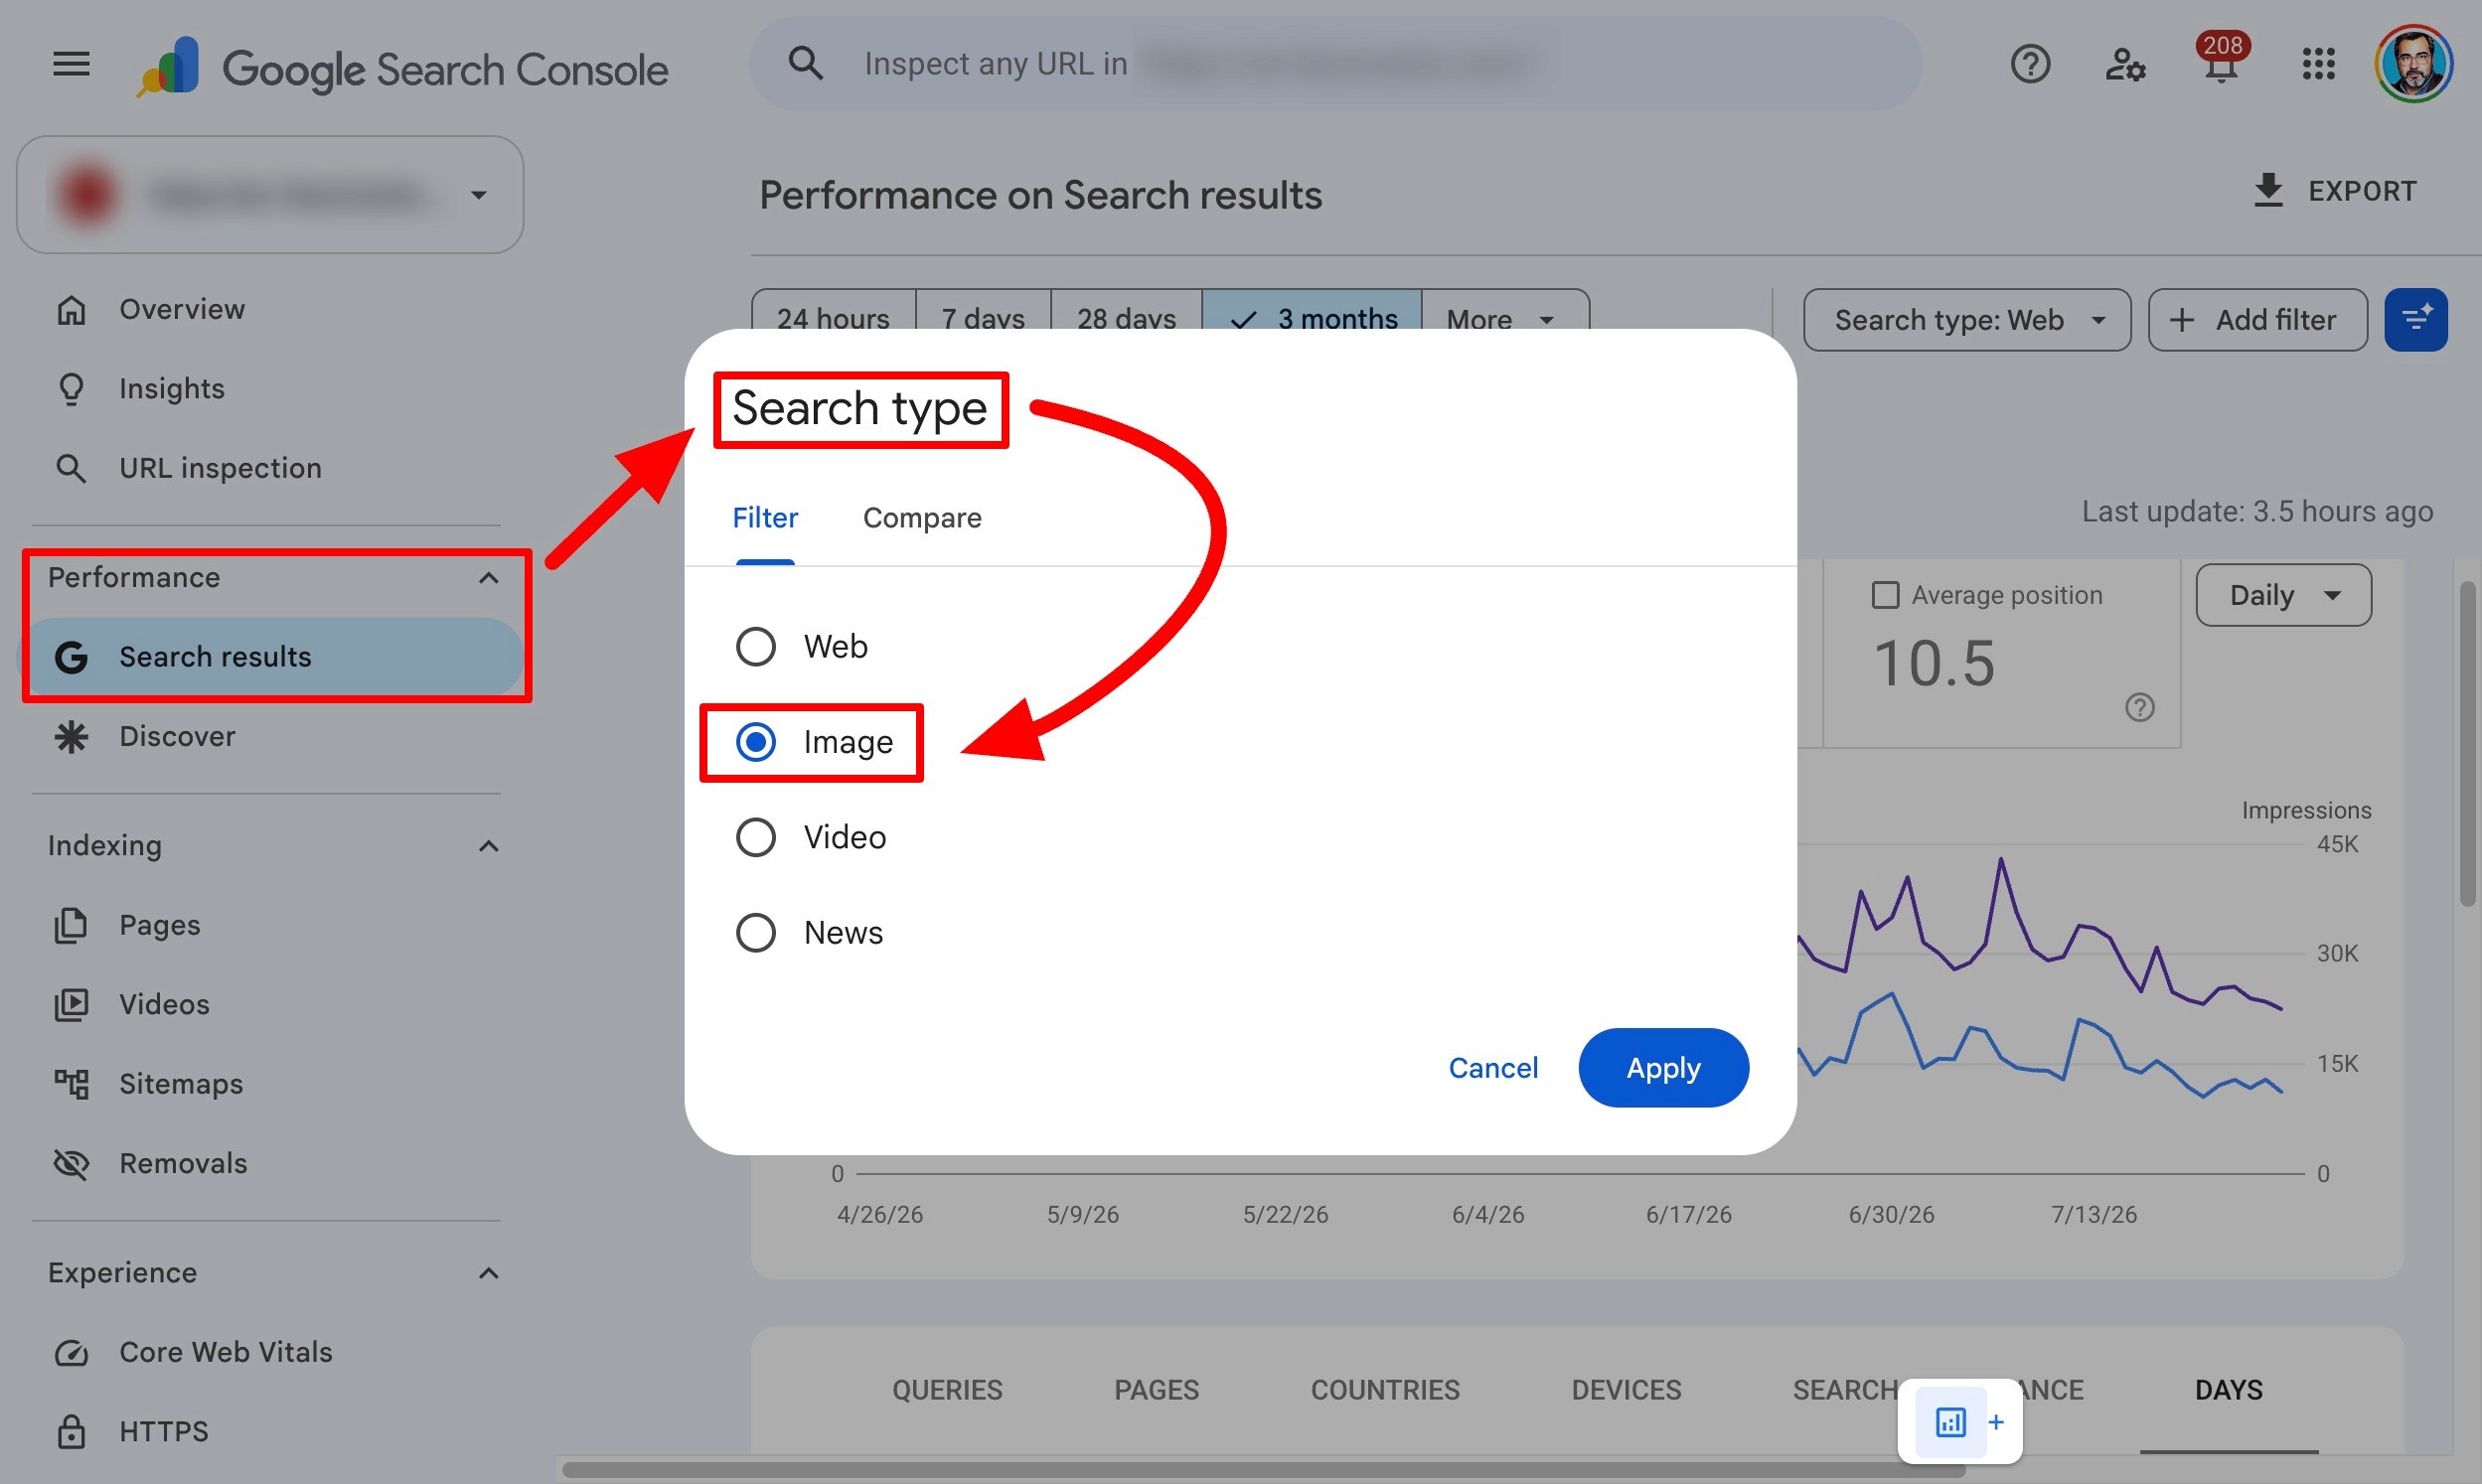
Used properly, it supports:
Baselining. What proportion of your search visibility is already visual? For many ecommerce sites the answer is surprising.
Page-level analysis. Which product and category pages earn image impressions, and which earn none despite having imagery.
Query analysis, with the usual caveats: image queries skew shorter and more descriptive than web queries, which is itself diagnostic of how people search visually.
Before-and-after measurement. This is where it earns its keep. Implement Product markup across a category, or re-shoot a product line, and the Image filter will show you the effect on impressions and position over the following weeks. It is the closest thing to a controlled test available.
Also useful: the Merchant listings and Product snippets enhancement reports flag structured data errors and warnings at scale — the fastest route to finding the missing availability fields and malformed offers that section 3 identified as the most common cause of a degraded product card.
What you do not get, and this is the important part:
No breakdown by surface. Image impressions do not distinguish the Images vertical from the Images box in web results, and Lens-originated appearances are not reported as a distinct category.
No AI Mode or AI Overview reporting. Appearances in AI surfaces are not broken out. If your product is named in an AI Mode answer, Search Console will not tell you.
No Lens metrics at all. There is no Lens report. Roughly 20 billion visual searches a month happen with no reporting surface attached.
Position means something different in a grid. "Average position" in a two-dimensional image grid is not the linear rank it describes in web results. Track it for direction, not for precision.
Turn visual search data into actionable insights
Advanced Web Ranking gives you a clearer view of visual search performance, from rankings in Google Images to image results in Universal SERPs and visibility across major AI engines.
Merchant Center and platform diagnostics
Merchant Center is where feed-level image problems surface and given section 6’s argument — feeds are the shared substrate of every machine-shopping surface — this is now more consequential than its traditional Shopping framing suggests.
Watch for:
Image quality warnings, including the 500 × 500 minimum arriving with warnings from April 2026 and enforcement from January 2027. If your catalogue predates that change, this is where you will find out.
Disapprovals for promotional overlays, watermarks, borders or generic placeholders.
Crawl failures on image URLs — frequently a robots.txt or hotlink-protection issue rather than a bad URL.
Price and availability mismatches between feed and page, which erode trust in both.
Elsewhere:
Bing Webmaster Tools provides image-specific reporting Search Console does not, plus Copilot-related diagnostics. Free, and worth the setup for the reporting alone.
Pinterest Analytics reports impressions, saves and outbound clicks per Pin. Saves are the distinctive metric, because a save is a stronger intent signal than a click, because it represents a shopper deciding to return.
Amazon Seller Central reports image compliance and search-term performance within Amazon’s ecosystem.
What remains unmeasurable, and how to proxy it
These things cannot currently be measured directly by anyone, regardless of tooling claims:
Lens-originated traffic. Traffic arriving from a Lens visual search is not distinguishable in analytics. There is no referrer that identifies it.
AI answer inclusion. Whether your product was named in an AI Mode answer, an AI Overview, or a ChatGPT response is not reported. Perplexity’s citation model makes it observable — it shows sources — but not systematically measurable at scale.
Attribution for image optimization specifically. You cannot isolate the effect of a re-shoot from everything else changing on the site and in the market simultaneously.
Exact vs. visual match performance. How often you appear in each Lens tab is unavailable.
Cross-surface influence. A shopper who saves your image to Collections, returns two weeks later and buys is invisible as a journey.
What to do instead. Proxies, clearly labelled as proxies:
Objective | Proxy |
|---|---|
Visual visibility overall | Search Console Image filter — impressions and position trend |
Structured data health | Merchant listings / Product snippets reports; Rich Results Test on representative templates |
Image recognisability | Object detection confidence scores on sample imagery (section 9) — testable, repeatable, independent of any platform |
Exact-match presence | Periodic manual Lens searches on your own imagery — do you appear, and where |
AI surface presence | Manual prompt testing across ChatGPT, Perplexity, AI Mode and Gemini on a fixed set of category and product queries, run on a schedule |
Direct traffic quality | utm_source=chatgpt.com and equivalent parameters where AI platforms append them |
Feed reach | Merchant Center, ACP and Perplexity merchant dashboards — active item counts and disapprovals |
Manual testing deserves defending, because it feels unrigorous and is not. Fix a panel of twenty queries spanning your main categories, run them monthly across the surfaces that matter, and record whether you appear and how. It is a small time commitment, it produces a longitudinal record nobody’s dashboard currently offers, and it is how most credible practitioner analysis in this space is actually being done. Discipline in the method — same queries, same intervals, recorded results — is what turns anecdote into evidence.
A note on tools claiming to measure AI visibility. A growing category of products offers "AI search visibility" tracking. Most work by running prompts at scale and recording mentions — which is the manual method, automated. That is genuinely useful and worth paying for at scale. It is not privileged access to platform data, because no such access exists. Buy them for the automation; do not buy them believing they see something you cannot.
Turn visual search data into actionable insights
Advanced Web Ranking gives you a clearer view of visual search performance, from rankings in Google Images to image results in Universal SERPs and visibility across major AI engines.
Setting expectations honestly
Given the above, the defensible position for anyone reporting internally on this work:
Measure what moves. Search Console image impressions, structured data error counts, feed health and detection-confidence scores are all real, trackable numbers responsive to the work in this guide.
Proxy what does not. Manual panel testing for AI and Lens presence, reported as directional evidence rather than as attribution.
Be explicit about the gap. "We cannot currently attribute revenue to Lens" is a defensible statement. "Lens delivered X" is not and will eventually be found out.
Argue from eligibility, not from measured return. This is the strongest available framing, and it is also true. The work in this guide is not primarily a traffic play with a calculable ROI — it is the condition of being eligible for surfaces that are growing quickly and reporting poorly. A product that is not in the index, is not in the feed and is not recognizable in the frame cannot appear anywhere, and no amount of measurement sophistication will change that.
The measurement will improve. Google has historically added reporting for surfaces once they mature, and image and AI reporting are conspicuous omissions that are unlikely to persist indefinitely. Sites that waited for the dashboard before doing the work will be starting from zero when it arrives.
You've reached the end of the guide.
Visual Search Beyond Google ← Previous · Back to the guide introduction →

Article by
Gianluca Fiorelli
With almost 20 years of experience in web marketing, Gianluca Fiorelli is a Strategic and International SEO Consultant who helps businesses improve their visibility and performance on organic search. Gianluca collaborated with clients from various industries and regions, such as Glassdoor, Idealista, Rastreator.com, Outsystems, Chess.com, SIXT Ride, Vegetables by Bayer, Visit California, Gamepix, James Edition and many others.
A very active member of the SEO community, Gianluca daily shares his insights and best practices on SEO, content, Search marketing strategy and the evolution of Search on social media channels such as X, Bluesky and LinkedIn and through the blog on his website: IloveSEO.net.