
Advice and answers from the Advanced Web Ranking Team
Search for articles
Google Data Studio Data Source Setup
Learn how to connect AWR to Data Studio. This guide covers all 9 available report types and the configuration options for each one.

The dedicated AWR connector lets you pull your SEO data into Data Studio, where you can combine it with traffic, conversions, and any other data sources you already track. The result: a single dashboard that gives clients and stakeholders the full picture, without switching between tools.
What this article covers
This article walks you through connecting AWR as a data source for Data Studio and explains the configuration options for each of the 9 available report types:
Visibility Date Comparison: ideal for visibility comparisons between ranking updates performed across one or several projects
Visibility Evolution In Time: pulls visibility trends over time, with granular filtering by website, search engine, and keyword group
Keyword Ranking Date Comparison: great for snapshot reports of keyword positions on a specific dates, with filtering by website, search engine, and rank bucket
Keyword Ranking Evolution In Time: designed for monitoring how a focused set of keywords moves over time
Market Share Evolution In Time: ideal for tracking how you and top 20 competitors share market visibility over time, per search engine and keyword group
Keyword Gap: great for analysis of your site against up to 4 competitors, with position, search volume, and difficulty data included
Keyword Difficulty: designed to help you prioritize SEO efforts based on global, domain, URL difficulty, and content score
AI Brand Visibility - Brands: ideal for monitoring how your brand shows up in AI-generated responses, including mentions, citations, and sentiment per LLM
AI Brand Visibility - Topics: great for topic-level analysis of how a specific brand performs across different topics in AI search results
Before you start
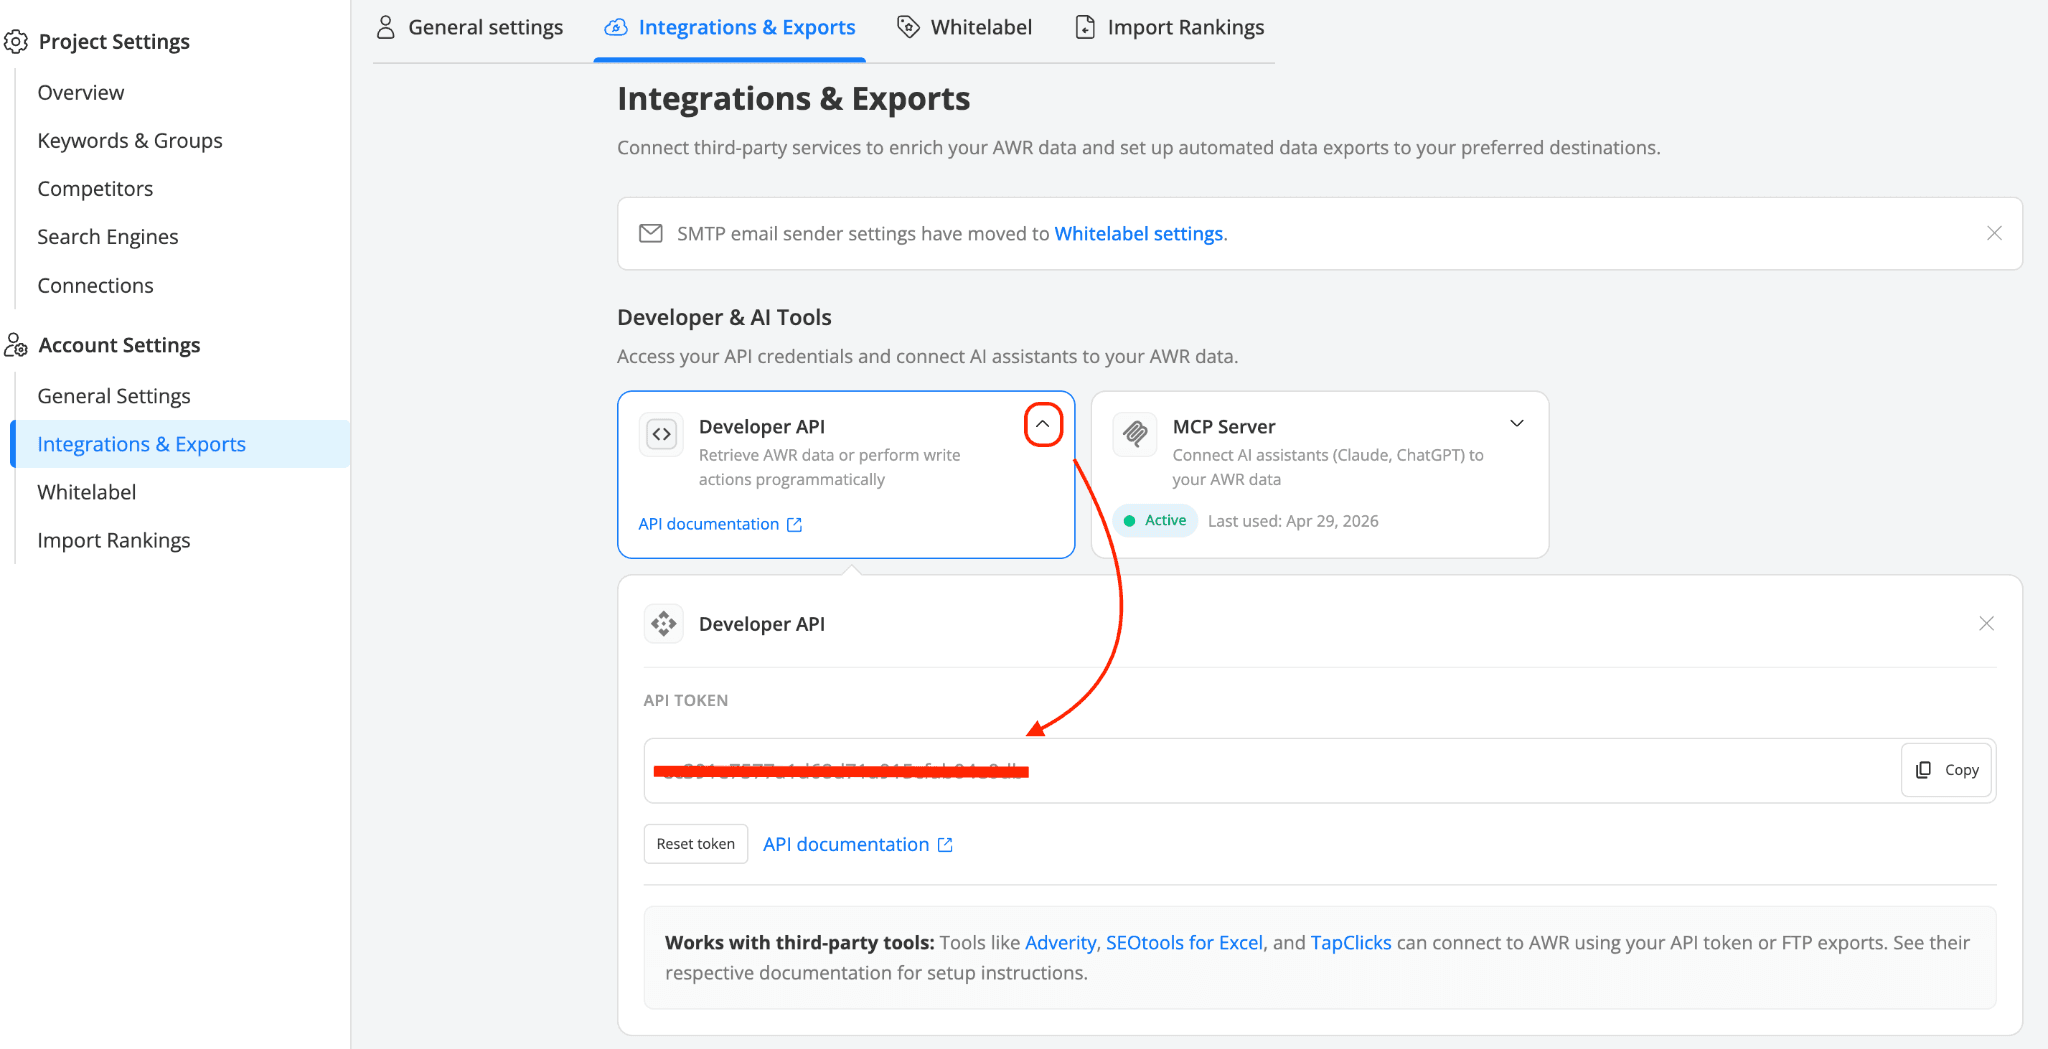
You need a valid AWR API token to set up the connection. The Developer API token is available on all yearly plans and on monthly subscriptions starting at the Agency level. You can find it in the Settings > Integrations & Exports section, in the Developer API card.
Step 1. Open the AWR connector
You can start the setup in two ways:
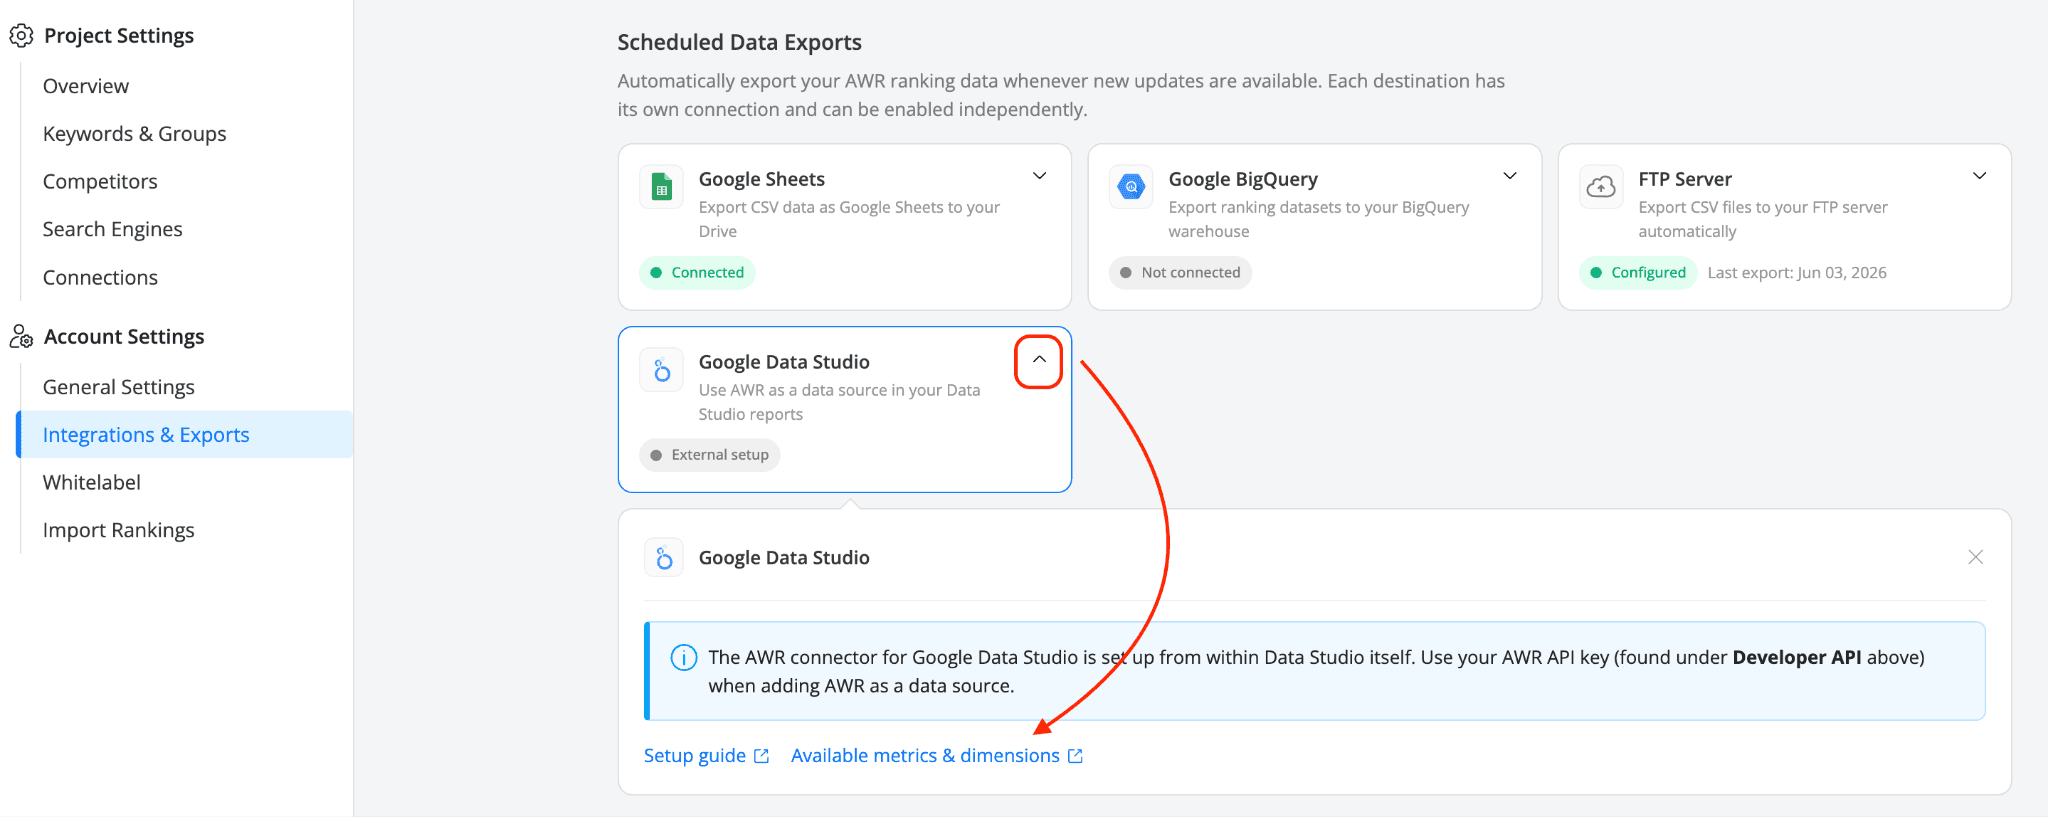
From AWR (recommended): go to Settings > Integrations & Exports, scroll to the Scheduled Data Exports section, and expand the Google Data Studio card. The card includes two links: Setup guide (opens this article) and Available metrics & dimensions (opens the connector configuration form in Data Studio). Click Available metrics & dimensions to start setup.
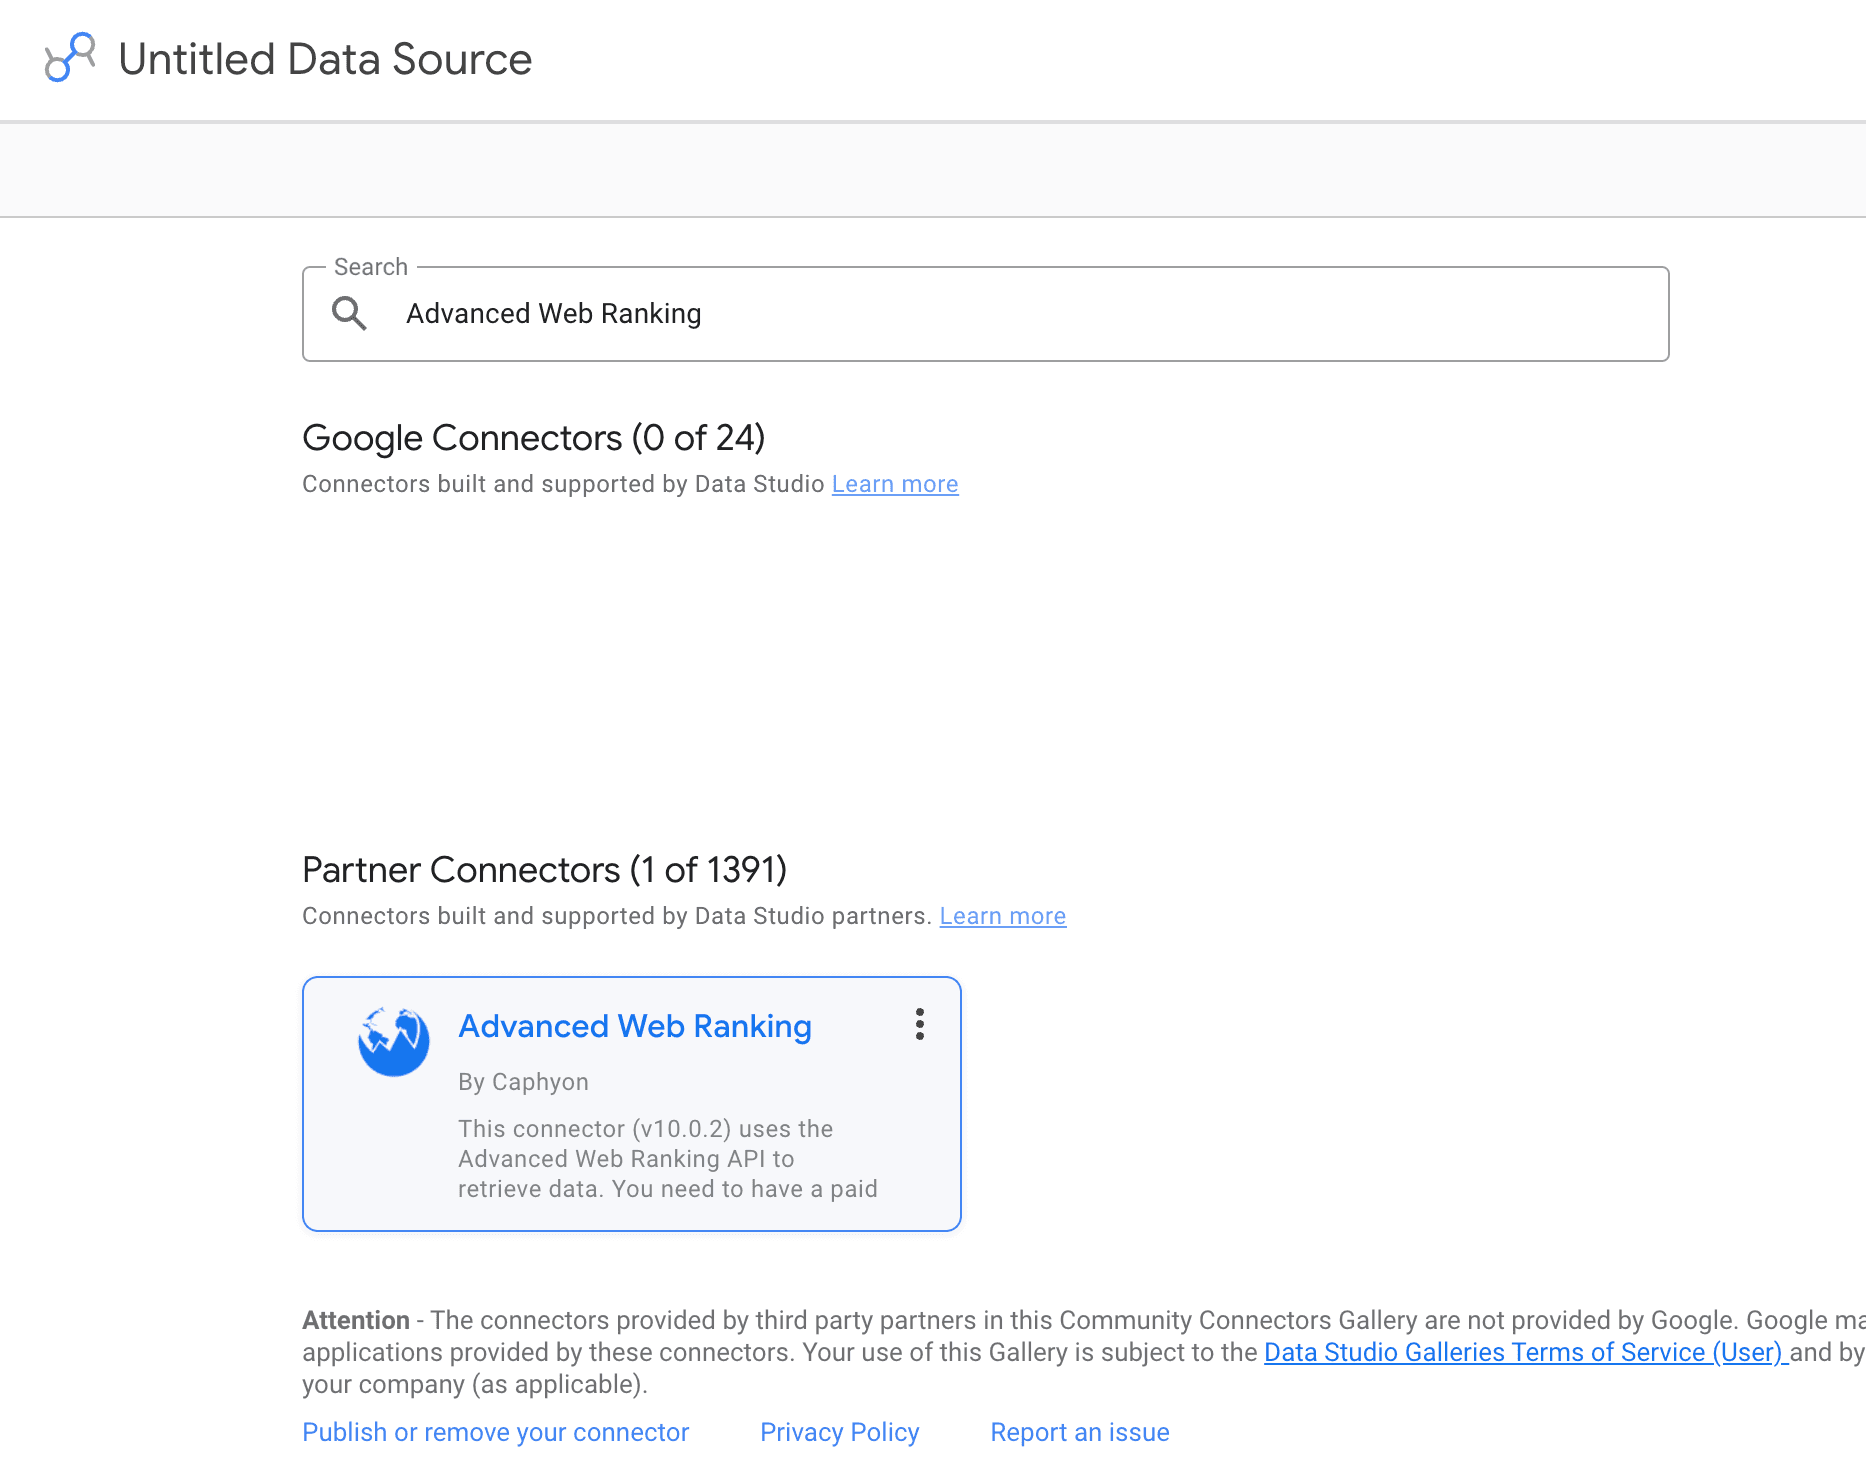
2. From Data Studio: go to Create > Data Source, search for Advanced Web Ranking, and select it.
Either way, you land on the same configuration form.
💡Why start from AWR? The link inside the Google Data Studio card always points to the latest version of the connector, with the newest data sources and parameters available. Starting from Data Studio can sometimes pull an older cached version of the connector that's missing recent improvements.
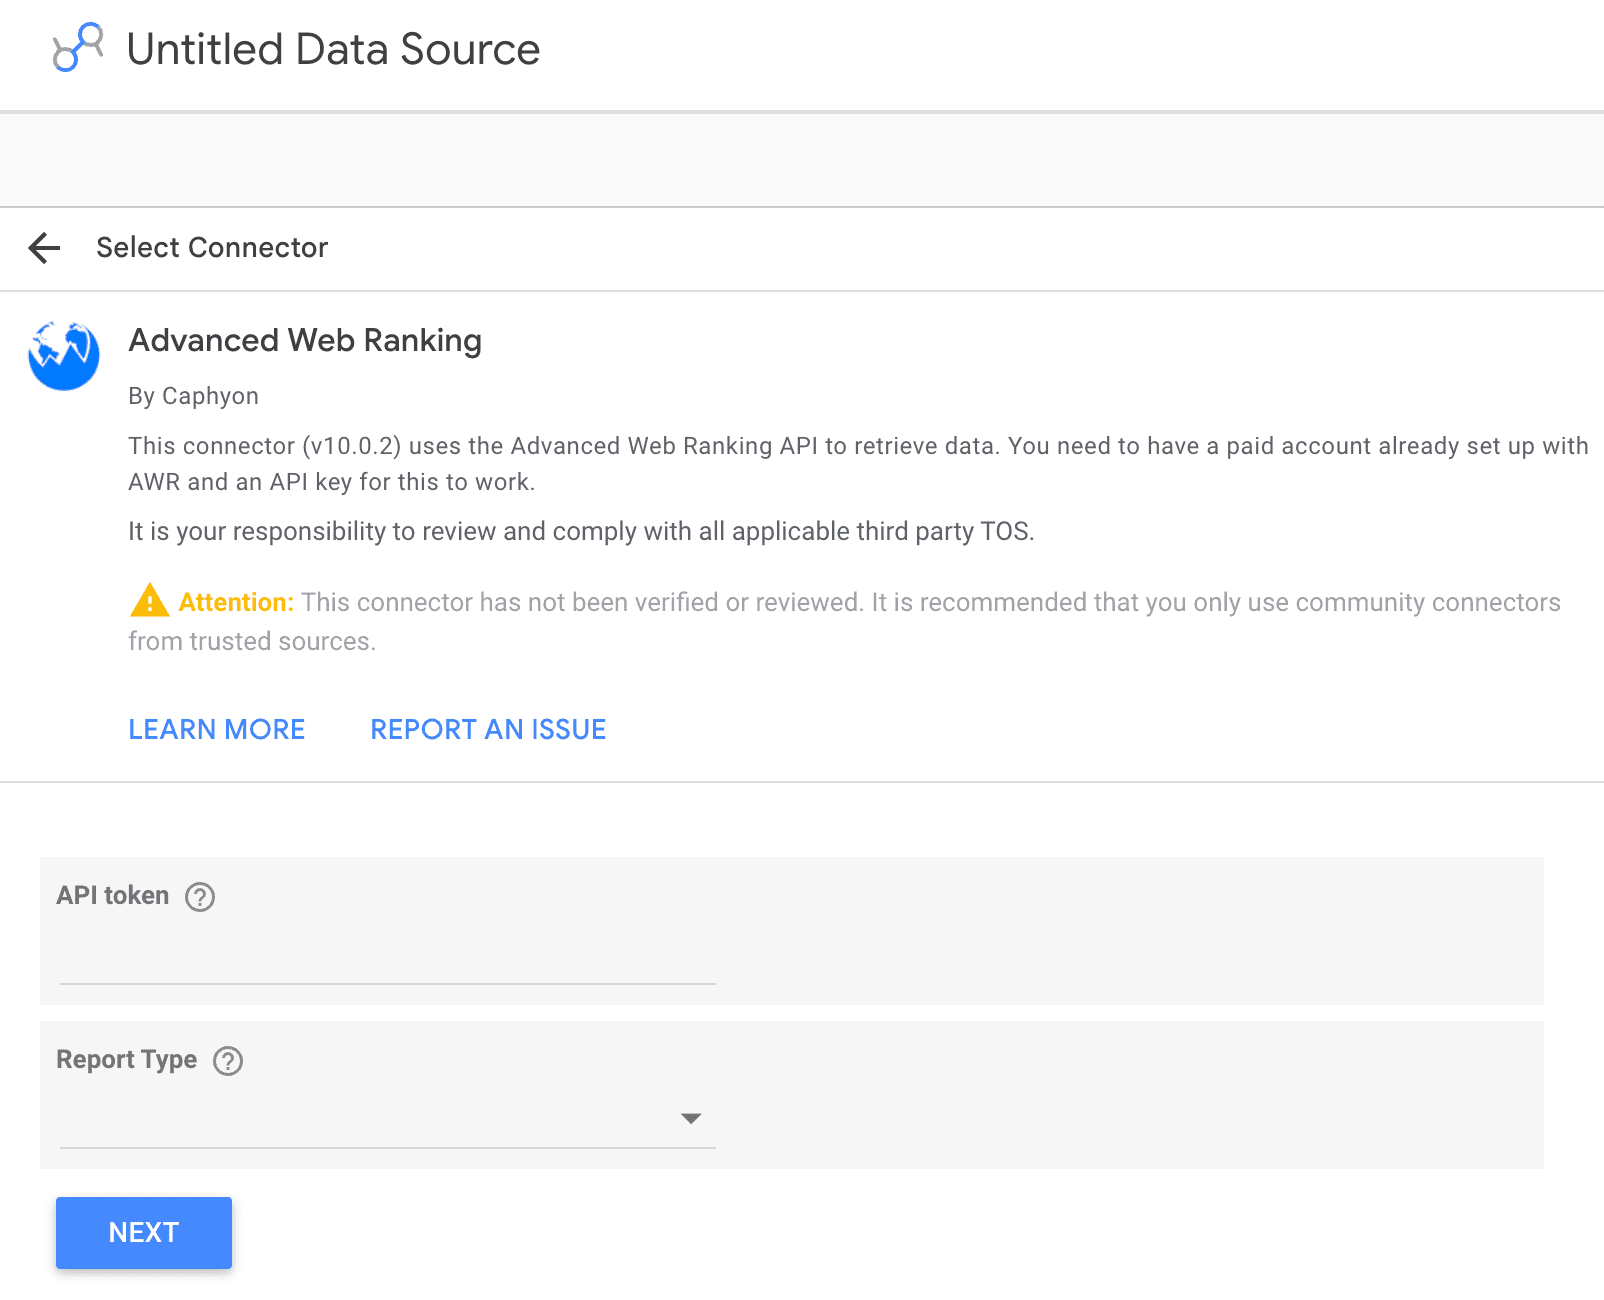
ℹ️ You may see a notice that the connector has not been verified by Google. This is standard for community connectors and nothing to worry about. The AWR connector is built and maintained by Caphyon.
Step 2. Enter your API token and choose a report type
Paste your AWR API token in the API token field, then open the Report Type dropdown and pick the data source you want to connect.

As mentioned at the beginning of the article, nine report types are available. Each report type pulls a different set of data from AWR. If you want to use multiple report types in your Data Studio, you need to set up a separate data source for each one.

Step 3. Configure the parameters
After selecting a report type, additional parameters appear below. These vary depending on how AWR data is configured for each report type. Here is what to expect for each one.
Visibility Date Comparison & Visibility Evolution In Time Data Sources
Both Visibility report types pull the same data set and accept the same parameters. The difference is in how the data comes out:
Date Comparison returns visibility values at specific update dates, ideal for snapshot-style reports that show the difference between two points in time (for example, "where we stand this month vs last month").
Visibility Evolution In Time returns the full series of visibility values across all updates in your selected range, ideal for line charts and trend reports.
Pick Date Comparison when you need scorecards or before/after comparisons. Pick Evolution In Time when you need to chart how visibility moves day by day or update by update.
Both report types let you pull visibility data for one or more projects in the same data source, so you can build multi-project reports without setting up a separate connection for each project.

Parameters:
Project filtering type: controls which projects are pulled in. Three options are available:
project name (exact match) connects a single specific project. The Project dropdown appears right below, so you can pick the one you want from the project list.
project name (partial match) pulls in every project whose name contains the string you enter.
project tag pulls in every project sharing a specific tag in AWR.
Name filter for projects or project tags: appears when you select partial name match or project tag. Enter the string or tag to match. For example, entering
recipespulls in every project whose name contains that word, and entering a tag name pulls in every project labeled with that tag in AWR.Project: appears when you select the exact match option. Pick the single project you want to connect.
Websites: select your main website and/or any competitors tracked in the selected project. Choose All Websites to include data for every domain tracked in the project.
Search Engines: select one or more search engines from the selected project, or choose All Search Engines to include all of them.
Keyword Groups: select one or more keyword groups, or choose All Keywords to include every keyword regardless of group.
ℹ️ Some parameters have an Allow to be modified in reports checkbox. When enabled, report editors can change the value directly in the report without reconnecting the data source. Useful when you want a single data source reused across multiple reports with different filter values.
💡 To keep your reports responsive, narrow down Websites, Search Engines, and Keyword Groups to only what you need. Selecting All across all three can pull in large data volumes, which slows report loading and rendering.
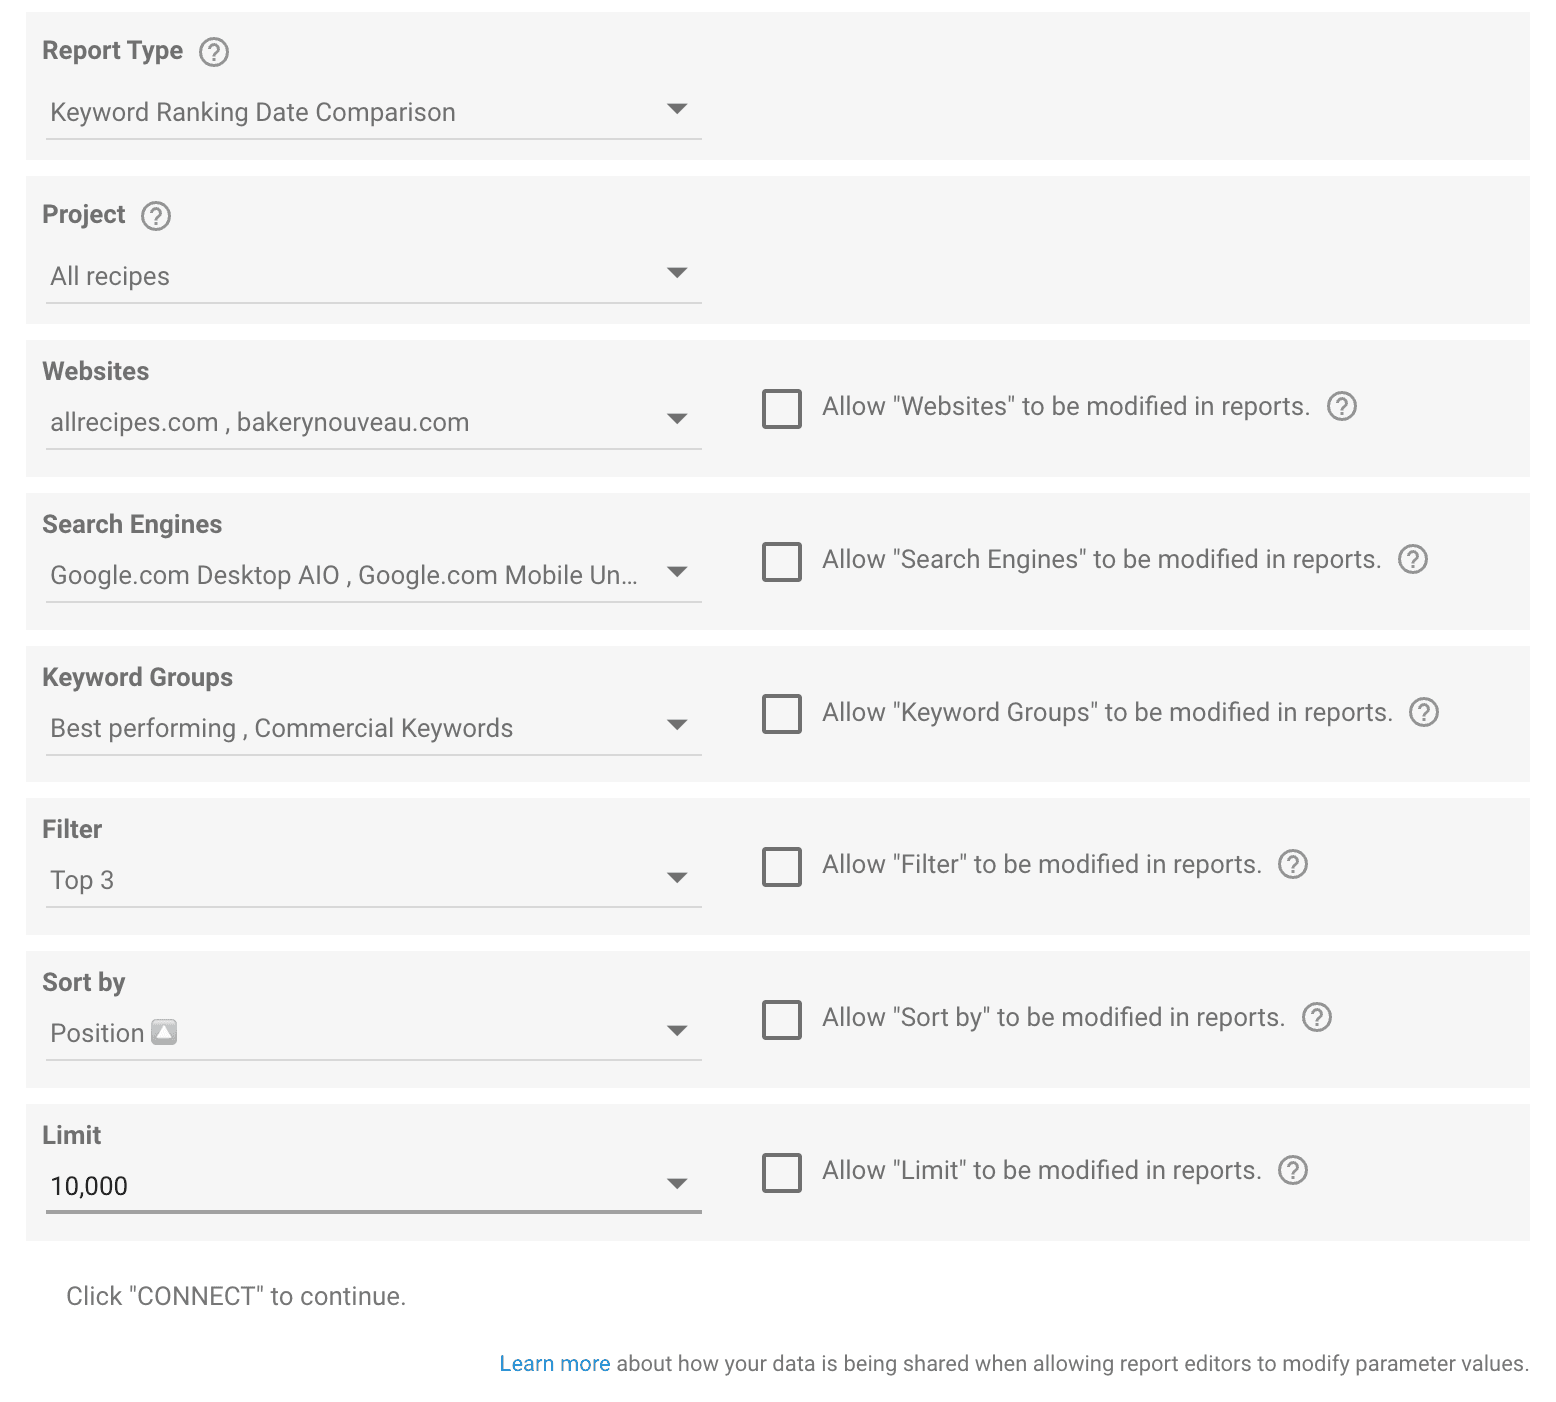
Keyword Ranking Date Comparison & Keyword Ranking Evolution In Time Data Sources
Both Keyword Ranking report types pull position data for the keywords in a single project. The difference is in how the data comes out and how much of it you can pull at once:
Date Comparison returns keyword positions on specific update dates, ideal for snapshot-style reports that compare two points in time. Supports exports of up to 250,000 rows, so it's the right pick for bulk analysis or large keyword sets.
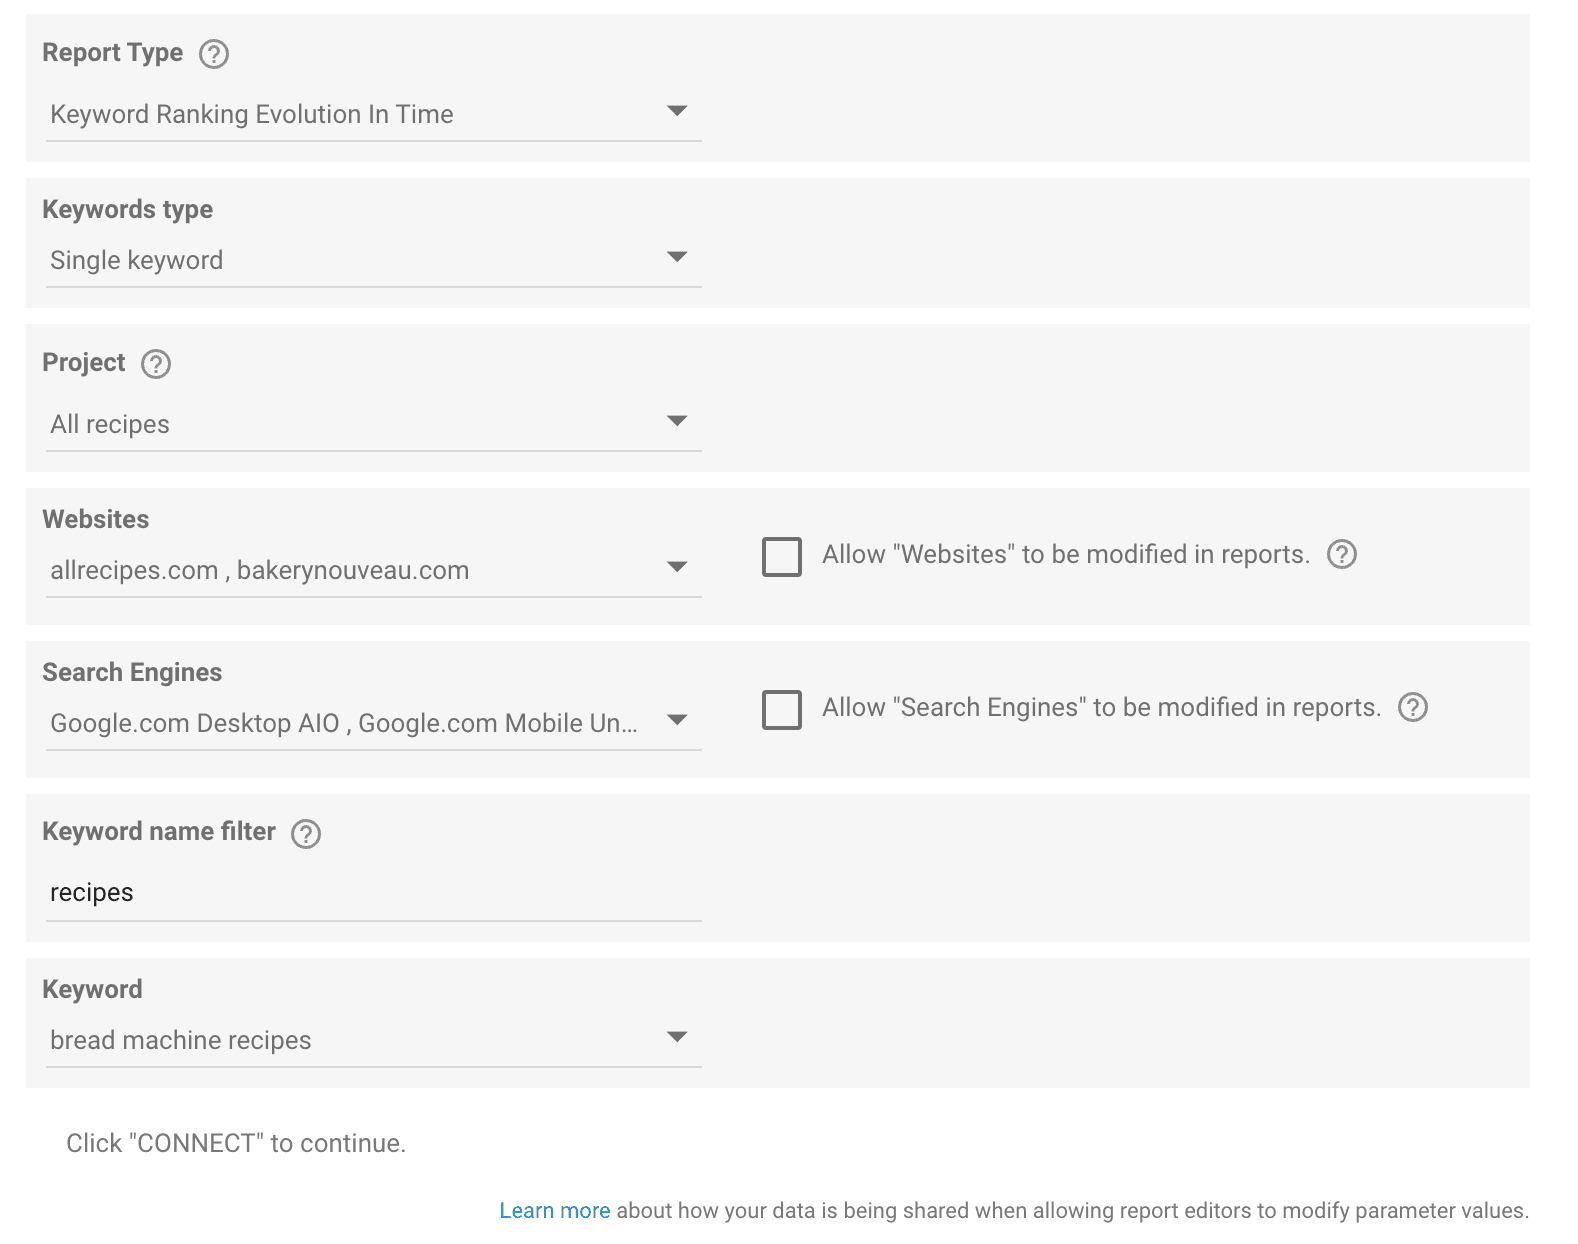
Evolution In Time returns the full series of positions across all updates in your selected range, ideal for tracking how individual keywords move over time. Capped at 250 rows, so it's built for focused tracking of a small keyword set, not bulk exports.
Pick Date Comparison when you need a wide snapshot or a before/after comparison across a large keyword list. Pick Evolution In Time when you want to follow a small set of keywords (or even a single one) update by update.
Shared parameters:
Project: select the AWR project to pull data from. Only one project per data source.
Websites: select your main website and/or any competitors tracked in the selected project. Choose All Websites to include every domain tracked in the project.
Search Engines: select one or more search engines from the selected project, or choose All Search Engines to include all of them.
The parameters below apply to Date Comparison by default. They also apply to Evolution In Time when the Keywords type is set to Multiple keywords.
Keyword Groups: select one or more keyword groups, or choose All Keywords to include every keyword regardless of group.
Filter: narrows down the keywords included in the data source based on where they rank. Options include Everything, First place, Top 3, Top 5, Top 10, Top 20, Top 30, First page, and Ranked.
Sort by: controls how rows are ordered in the data source. Sort by Position, CPC, or Search volume, ascending or descending.
Limit: sets the maximum number of rows included in the data source. Options range from 100 to 250,000 in Date Comparison, and 1 to 250 in Evolution In Time.
Evolution In Time adds one extra parameter not found in Date Comparison: Keywords type, which controls how the report tracks keywords over time.
Multiple keywords is the default mode. It uses the Keyword Groups, Filter, Sort by, and Limit parameters described above to pull a defined set of keywords, with positions tracked across the selected time range.
Single keyword narrows the report down to just one specific keyword. When you pick this mode, the Keyword Groups, Filter, Sort by, and Limit parameters disappear, and two new ones take their place:
Keyword name filter: type a few letters to narrow down the Keyword dropdown to keywords containing that string. For example, typing
recipeshows options likerecipe of the dayorbread machine recipe.Keyword: pick the specific keyword you want to track over time.
💡 For Date Comparison, narrow down Websites, Search Engines, and Keyword Groups to only what you really need, and use Filter and Limit to focus on the data that matters most. Selecting All across all three plus a high Limit can pull in massive data volumes and slow your Data Studio reports.
Market Share Evolution In Time
This report type pulls market share data over time for a single combination of project, search engine, and keyword group.

Parameters:
Project: select the project to connect. Only one project can be used per data source.
Search Engines: select a single search engine. Unlike other report types, this one does not support multiple search engines or an All Search Engines option.
Keyword Group: select a single keyword group, or choose All Keywords to include all keywords regardless of group.
The data source automatically includes the top 20 websites with market share data for the selected search engine, so there is no Websites parameter to configure. If you want to compare market share across multiple search engines or keyword groups, set up separate data sources for each combination.
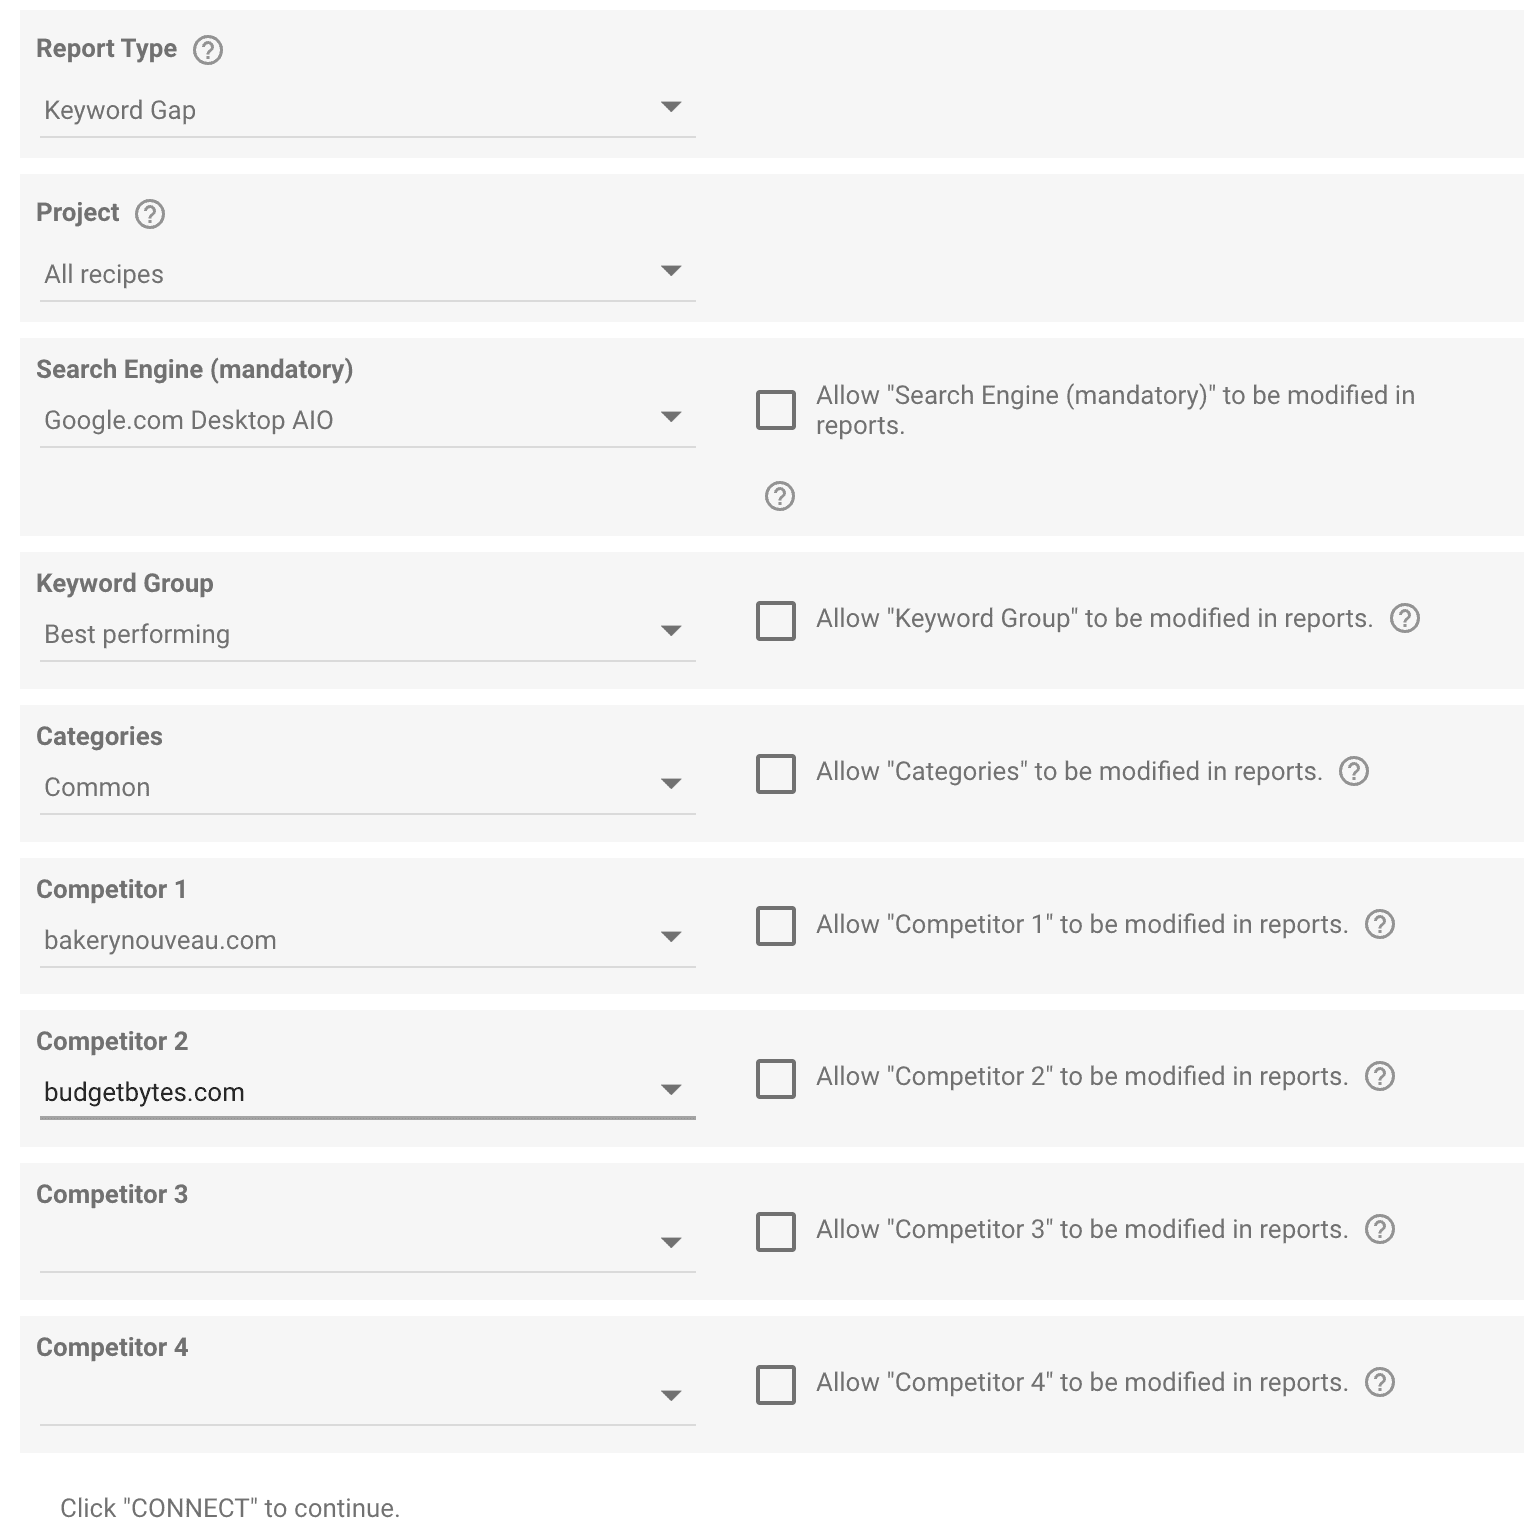
Keyword Gap
This report type pulls keyword data for a project’s main website and up to 4 competitors in the same data source, ready to be used however you need in your Data Studio report.
Parameters:
Project: select the project to connect. Only one project can be used per data source.
Search Engine (mandatory): select a single search engine. This is the only report type where a search engine selection is required before you can proceed.
Keyword Group: select a single keyword group, or choose All Keywords to include all keywords regardless of group.
Categories: optionally filter by one of the keyword gap categories used in AWR's competitor analysis: All keywords, Common, Absent, Unexplored, Underperforming, Outperforming, or Exclusive. For more on what each category means, see How to Analyze Your Competitors in AI Search with AWR.
Competitor 1 through Competitor 4: select up to 4 competitors to include in the data source alongside your main website. Each field has a No competitor option, so you can leave any slots empty if you do not need all 4.
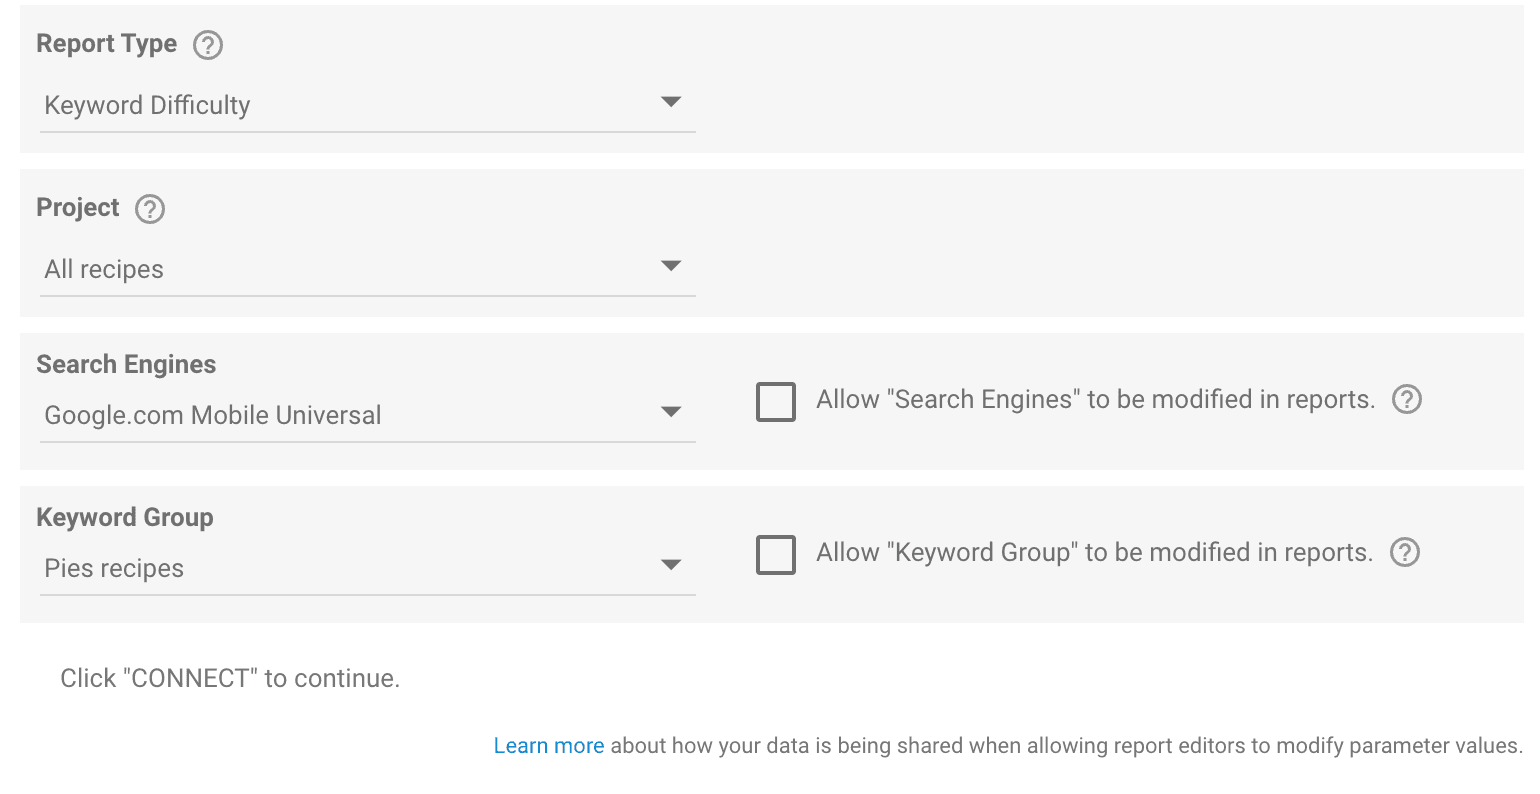
Keyword Difficulty
This report type pulls keyword difficulty data for the keywords in your project, including global difficulty, domain difficulty, URL difficulty, and content score.
Parameters:
Project: select the project to connect. Only one project can be used per data source.
Search Engines: select the search engine you want to pull difficulty data for. Only one can be selected at a time.
Keyword Group: select a single keyword group, or choose All Keywords to include all keywords regardless of group.
AI Brand Visibility - Brands & AI Brand Visibility - Topics
Both AI Brand Visibility report types pull data from how LLMs reference your brand in AI-generated responses. The difference is in the angle of analysis:
Brands pull in all tracked brands inside a single LLM and topic scope, surfacing metrics like Mentions, Citations, Sentiment, Visibility percent, and Average rank for each brand. Pick this when you want a competitive view of how your brand stacks up against others in AI responses.
Topics flips the view: you pick one brand and see how it performs across the topics an LLM associates with it, with Visibility and Average rank plus intent signals. Pick this when you want to understand which themes are pulling your brand into AI conversations.
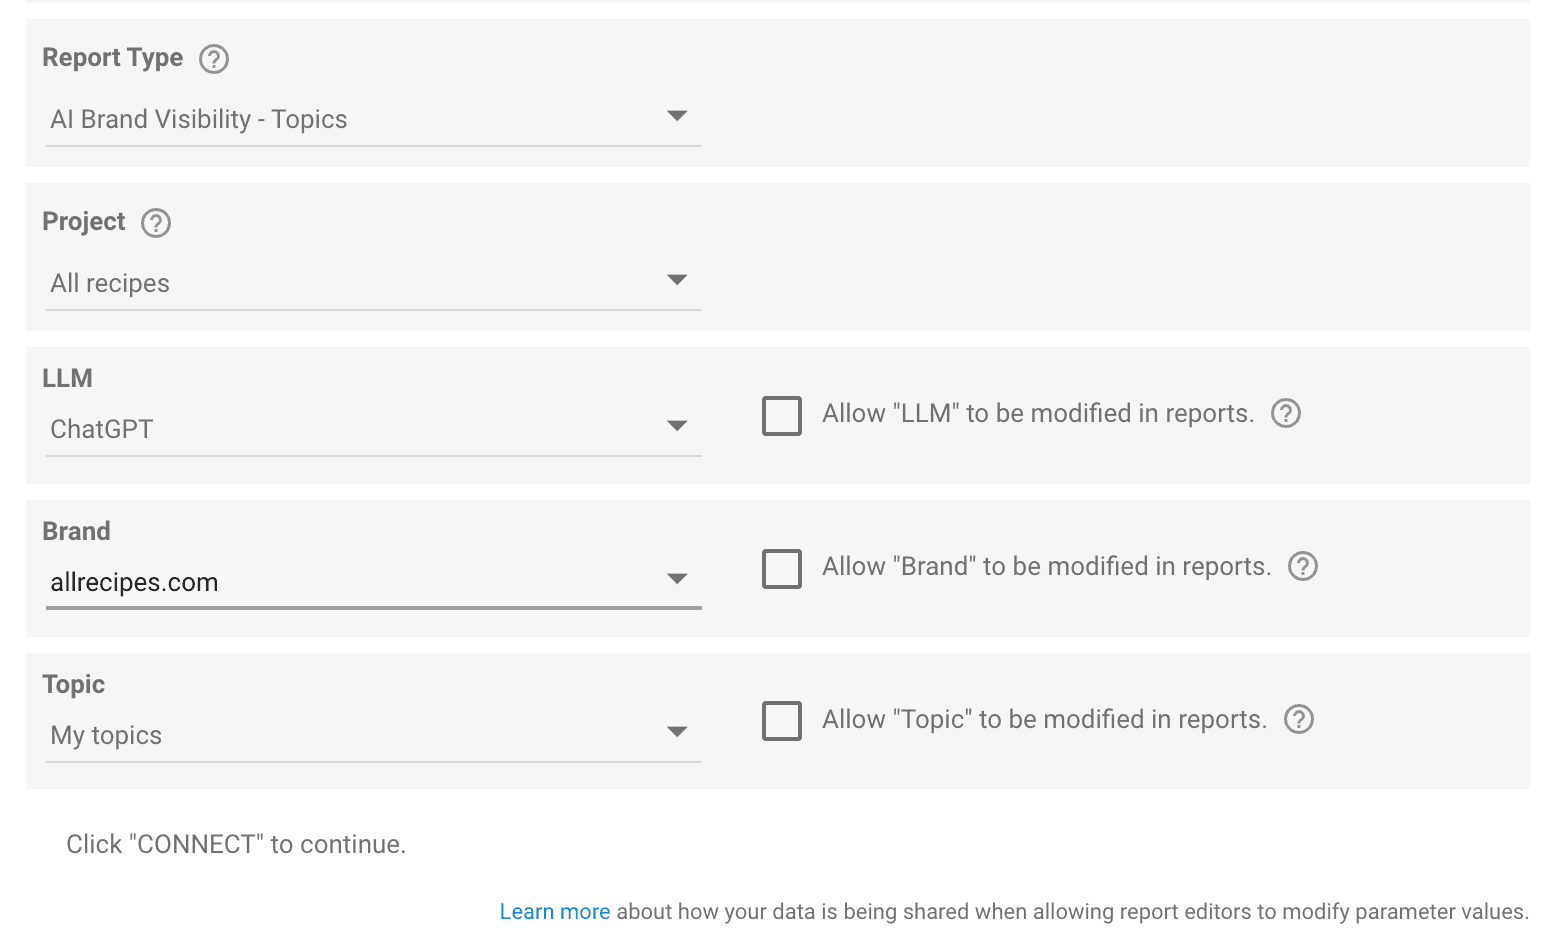
Shared parameters:
Project: select the AWR project to pull data from. Only one project per data source.
LLM: select the AI model you want to pull data from (such as ChatGPT, Gemini, Perplexity, or Claude). Available options depend on what your AWR project tracks.
Topic: filters the data by topic. The dropdown includes 3 preset groups plus any custom topics defined in your project:
All topics: every topic in the project, both auto-discovered and custom
AI topics: only topics automatically detected by AWR
My topics: only the custom topics you added during update setup
Any specific topic from the project's list that you have manually added
The Topics report type adds one extra parameter not found in Brands reports:
Brand: select the brand you want to analyze. The dropdown includes your main brand and any competitor brand in the project.
Step 4. Connect and review field mapping
Once you have filled in the parameters, click Connect. Data Studio loads the field mapping screen, where you can see all the dimensions, metrics, and parameters available for the report type you selected.
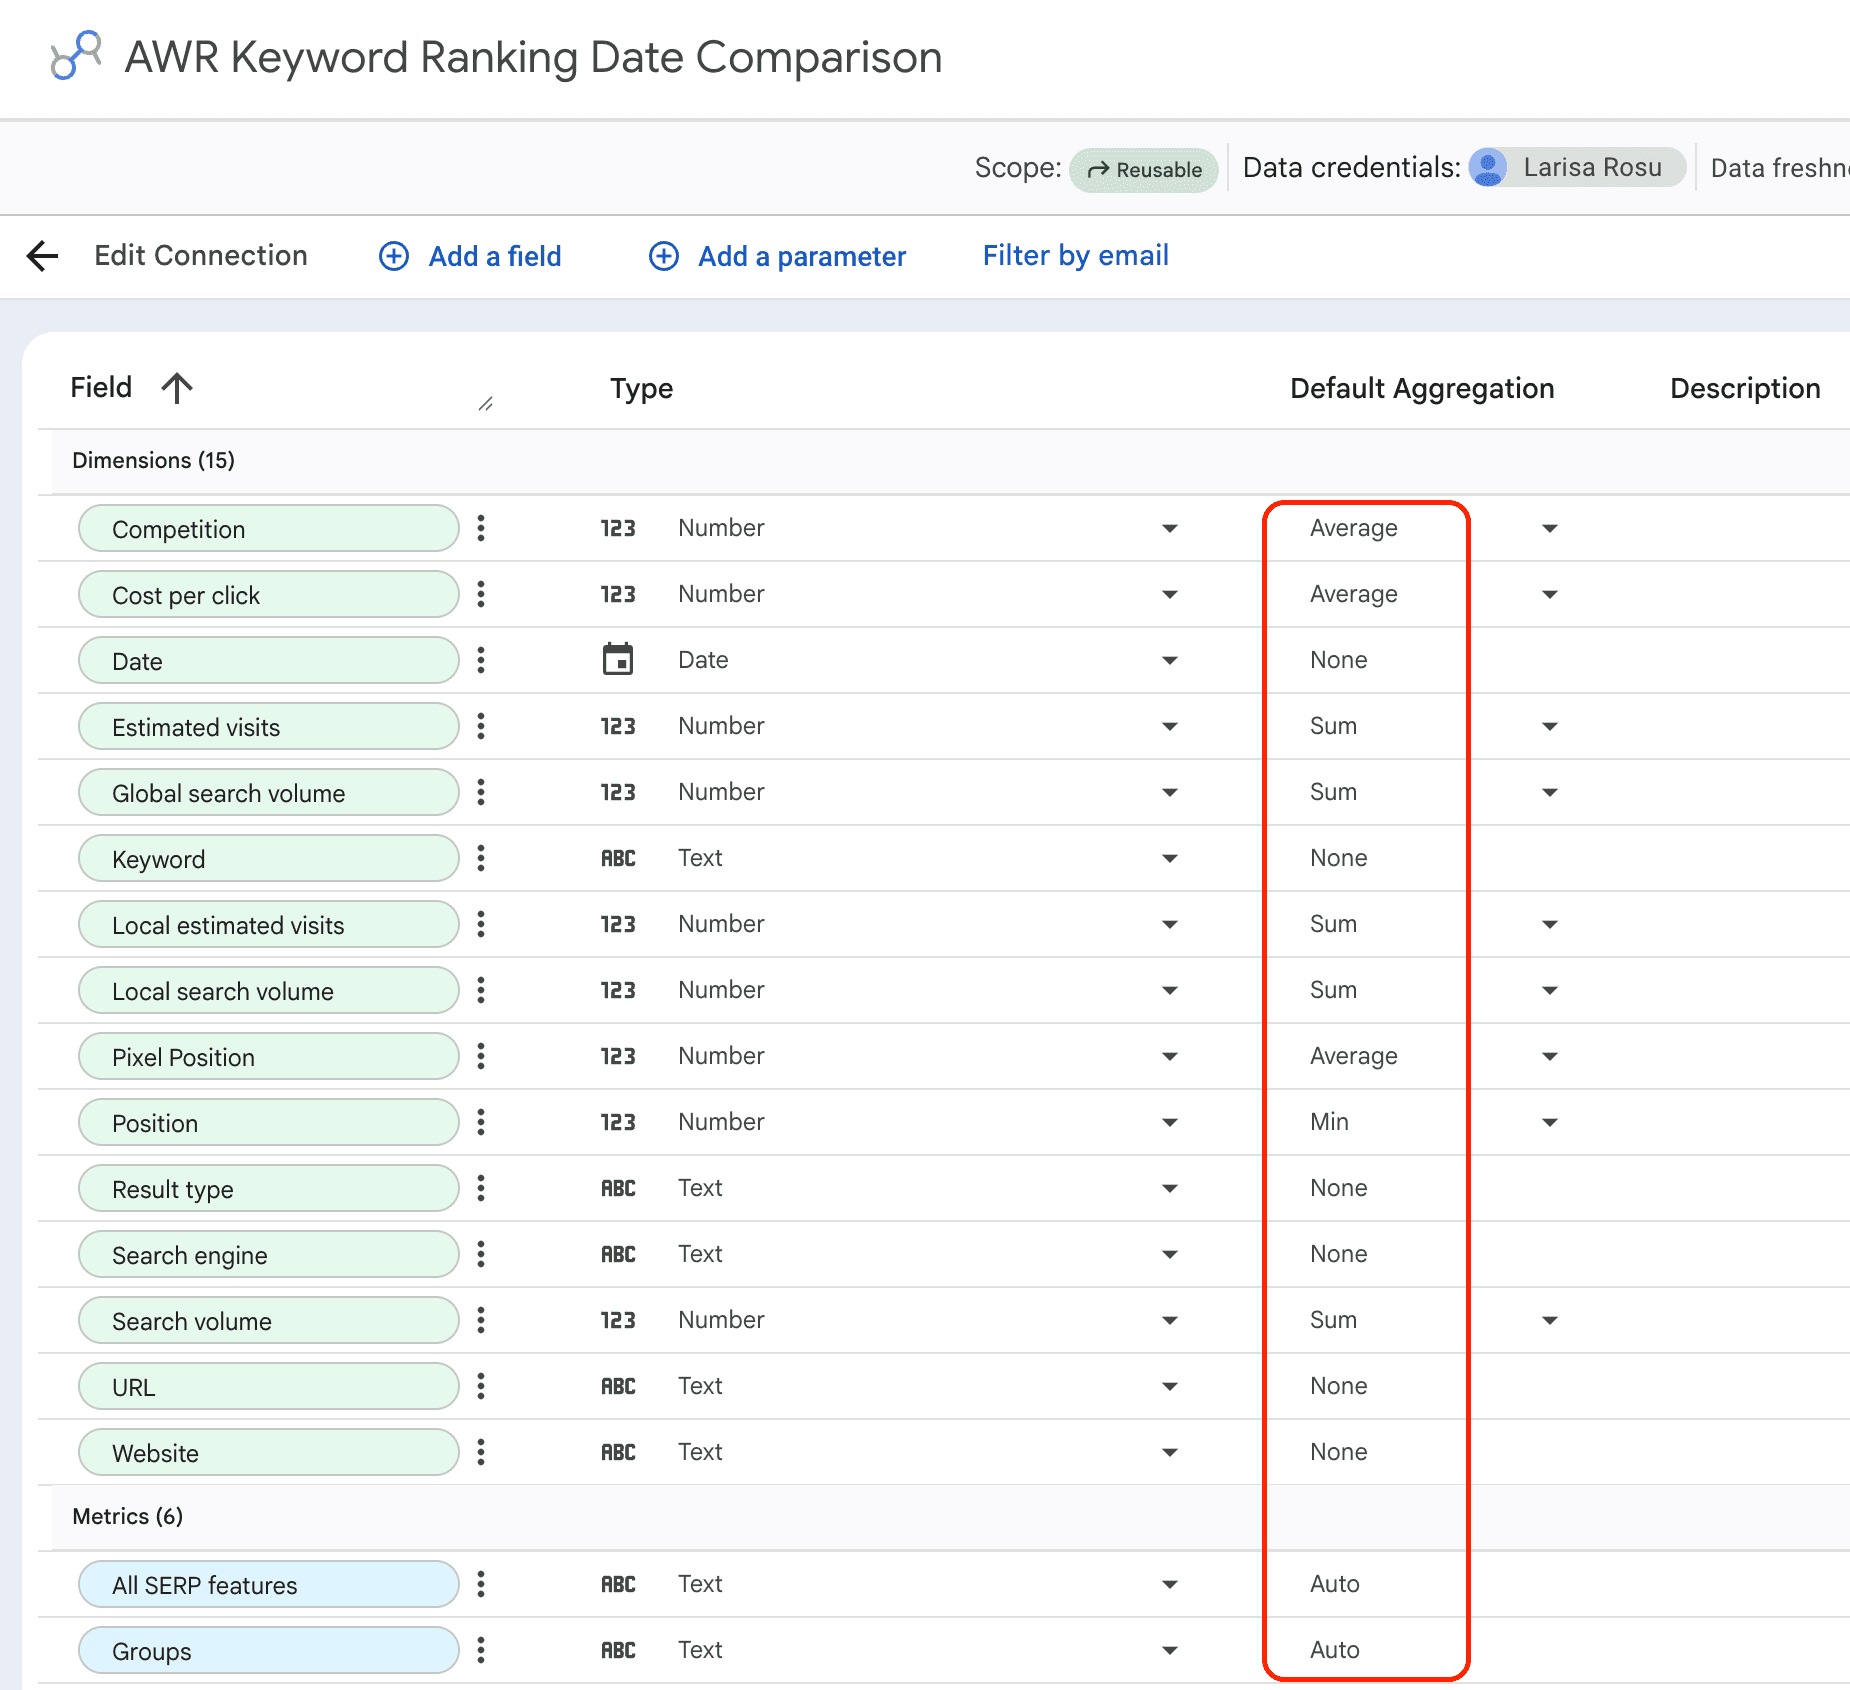
From here, click Create Report to start a new report, or save it for later and use the newly created data source in an existing report from Data Studio's data source list.
💡 The default field types and aggregation methods are configured to match how AWR calculates data, so it is best to leave them as they are unless you have a specific reason to change them. Changing the aggregation method on fields like Visibility percent, Average rank, or any Sum-based metric will produce values that differ from what you see in AWR.
For more on why numbers may not match between Data Studio and AWR, see Different visibility numbers in Google Data Studio versus AWR. Why?.
Complete list of AWR metrics available per report type
For a full list of AWR metrics available per report type, see:
Google API Disclosure: AWR's use and transfer to any other app of information received from Google APIs will adhere to the Google API Services User Data Policy, including the Limited Use requirements.
stay in the loop