

Advice and answers from the Advanced Web Ranking Team
Search for articles
Improved Ranking Distribution Report: More Flexibility, More Insights
Explore the enhanced Ranking Distribution report with flexible position ranges, trend charts and keyword movement insights for smarter SEO analysis

Ranking #1 for one keyword and ranking #47 for another both count as "ranking," but they don't mean the same thing for your traffic, your visibility, or your next move. The Ranking Distribution report exists to show you that difference at a glance: how your keywords are spread across position buckets, how that spread is shifting over time, and how you stack up against competitors doing the same thing.
A table full of keywords and their rankings doesn't tell you much on its own, and figuring out how many of the rankings actually changed, and by how much, can be a hard mission. This is why we made some upgrades to the Ranking Distribution report, to make the analysis even easier.
Here’s what’s new:
A cleaner, more modern report table, with customizable websites and position ranges
The distribution table has been refreshed with a cleaner layout, making it easier to scan, compare websites across position distribution buckets and quickly identify changes over time.
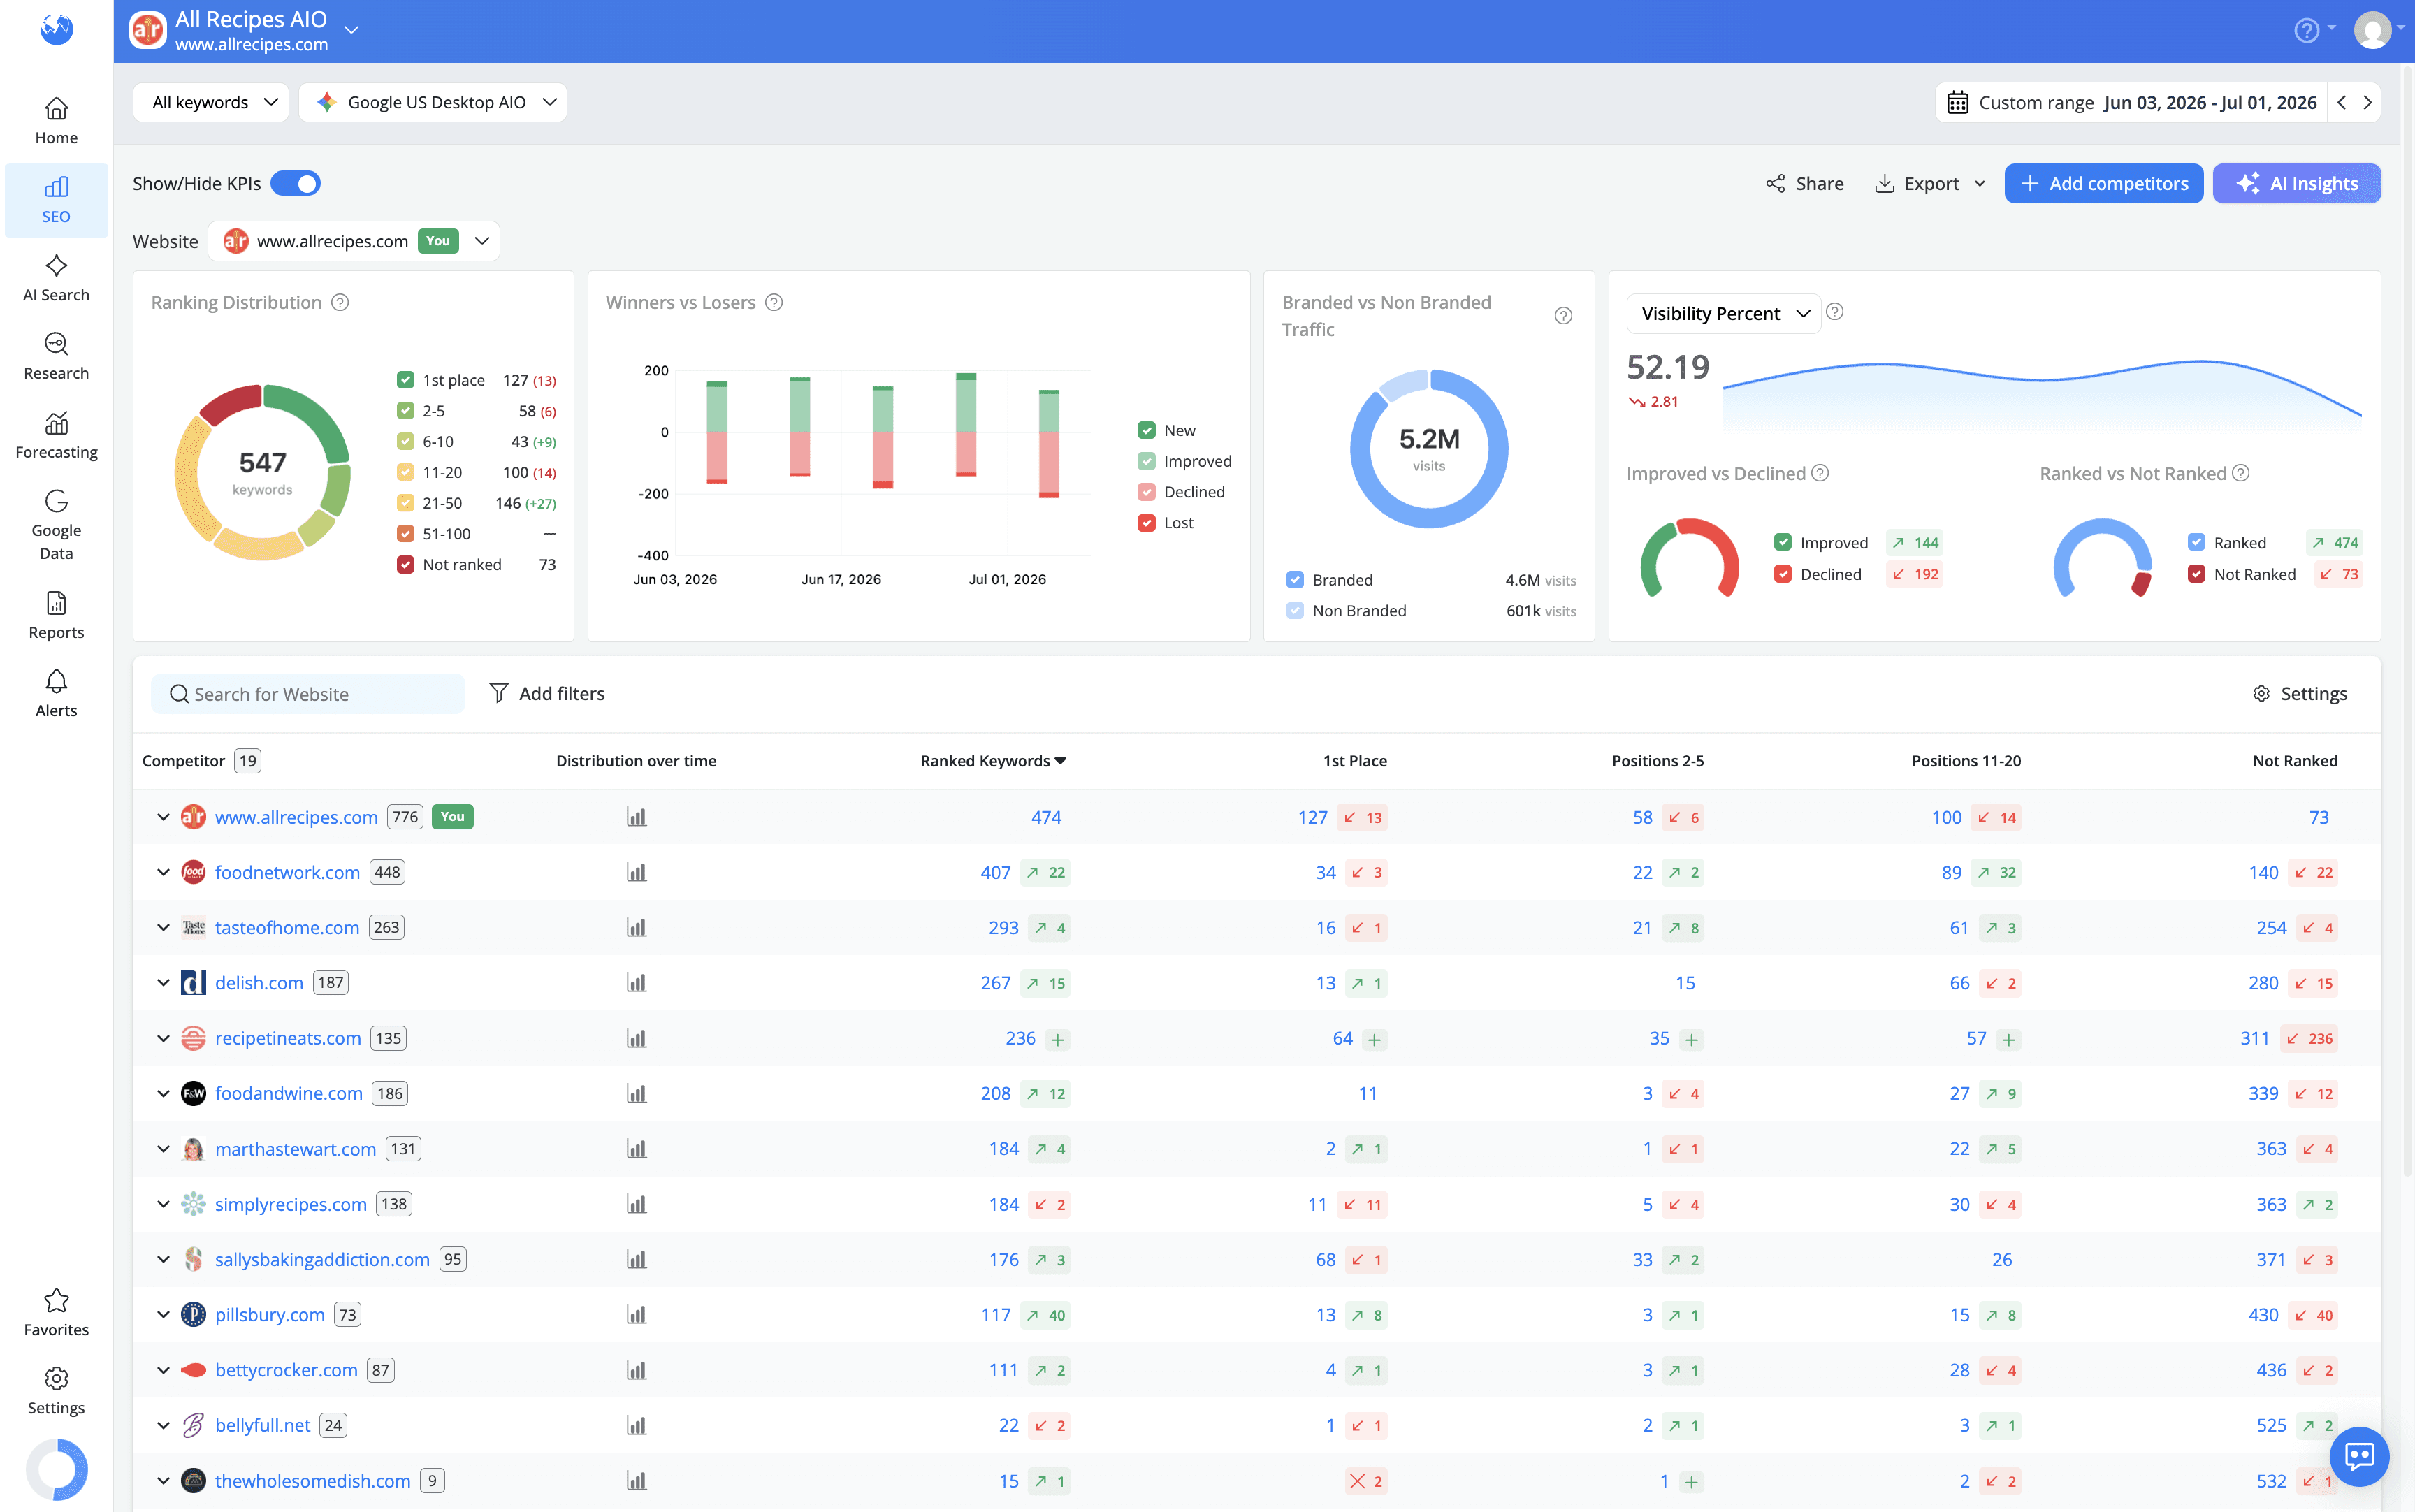
The biggest improvement, however, is the added flexibility. You can now choose exactly which websites appear in the table and customize the position ranges instead of relying on fixed ranking buckets.

This means you can tailor the report to match your SEO goals. For example, if most of your keywords already rank on the first page, you can use narrower ranges such as positions 2-5 and 6–10 to better monitor your top-performing keywords. If you're focused on improving visibility, you can create broader ranges that distinguish between page one, page two and lower rankings.
By customizing both the websites and the position ranges, you can focus on the data that matters most, uncover trends more easily and make comparisons that are more relevant to your SEO strategy.
Inline distribution trends at domain and URL level
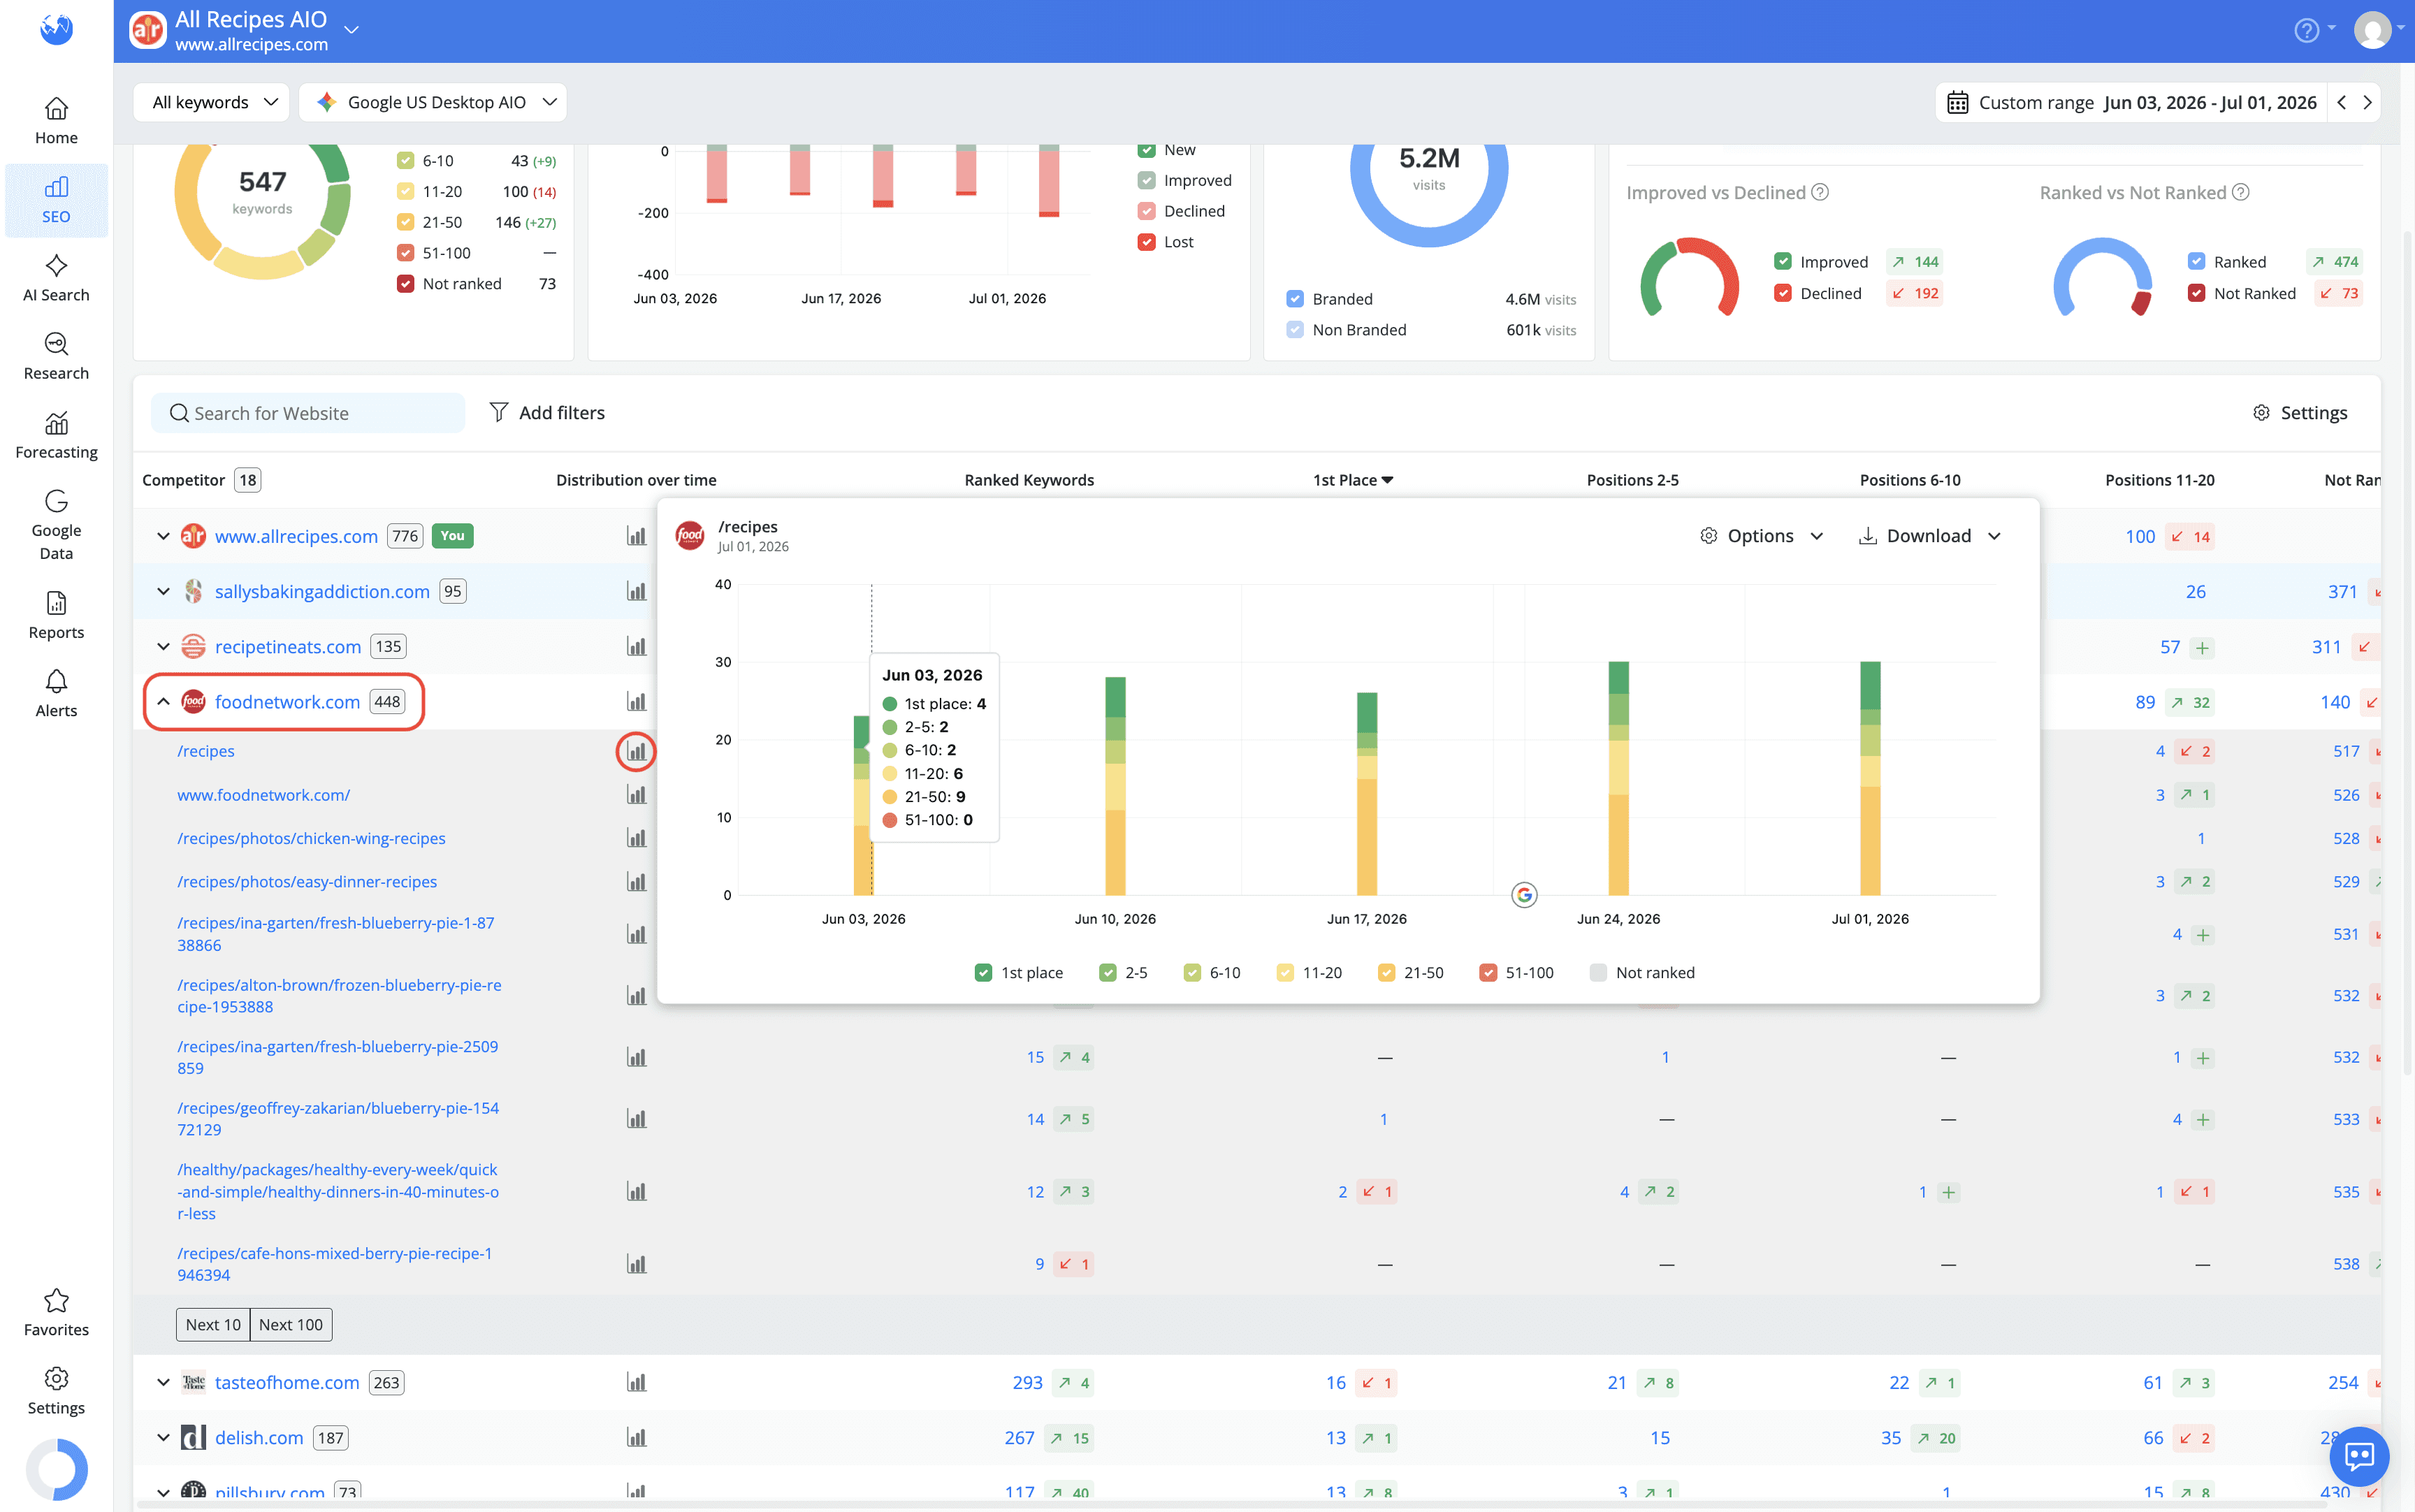
Every website in the table now has its own trend icon that opens a chart showing how its ranking distribution changed across your selected date range. The chart uses the same position buckets as the rest of the report and hovering over any bar or data point reveals the exact keyword count for each bucket on that specific update.
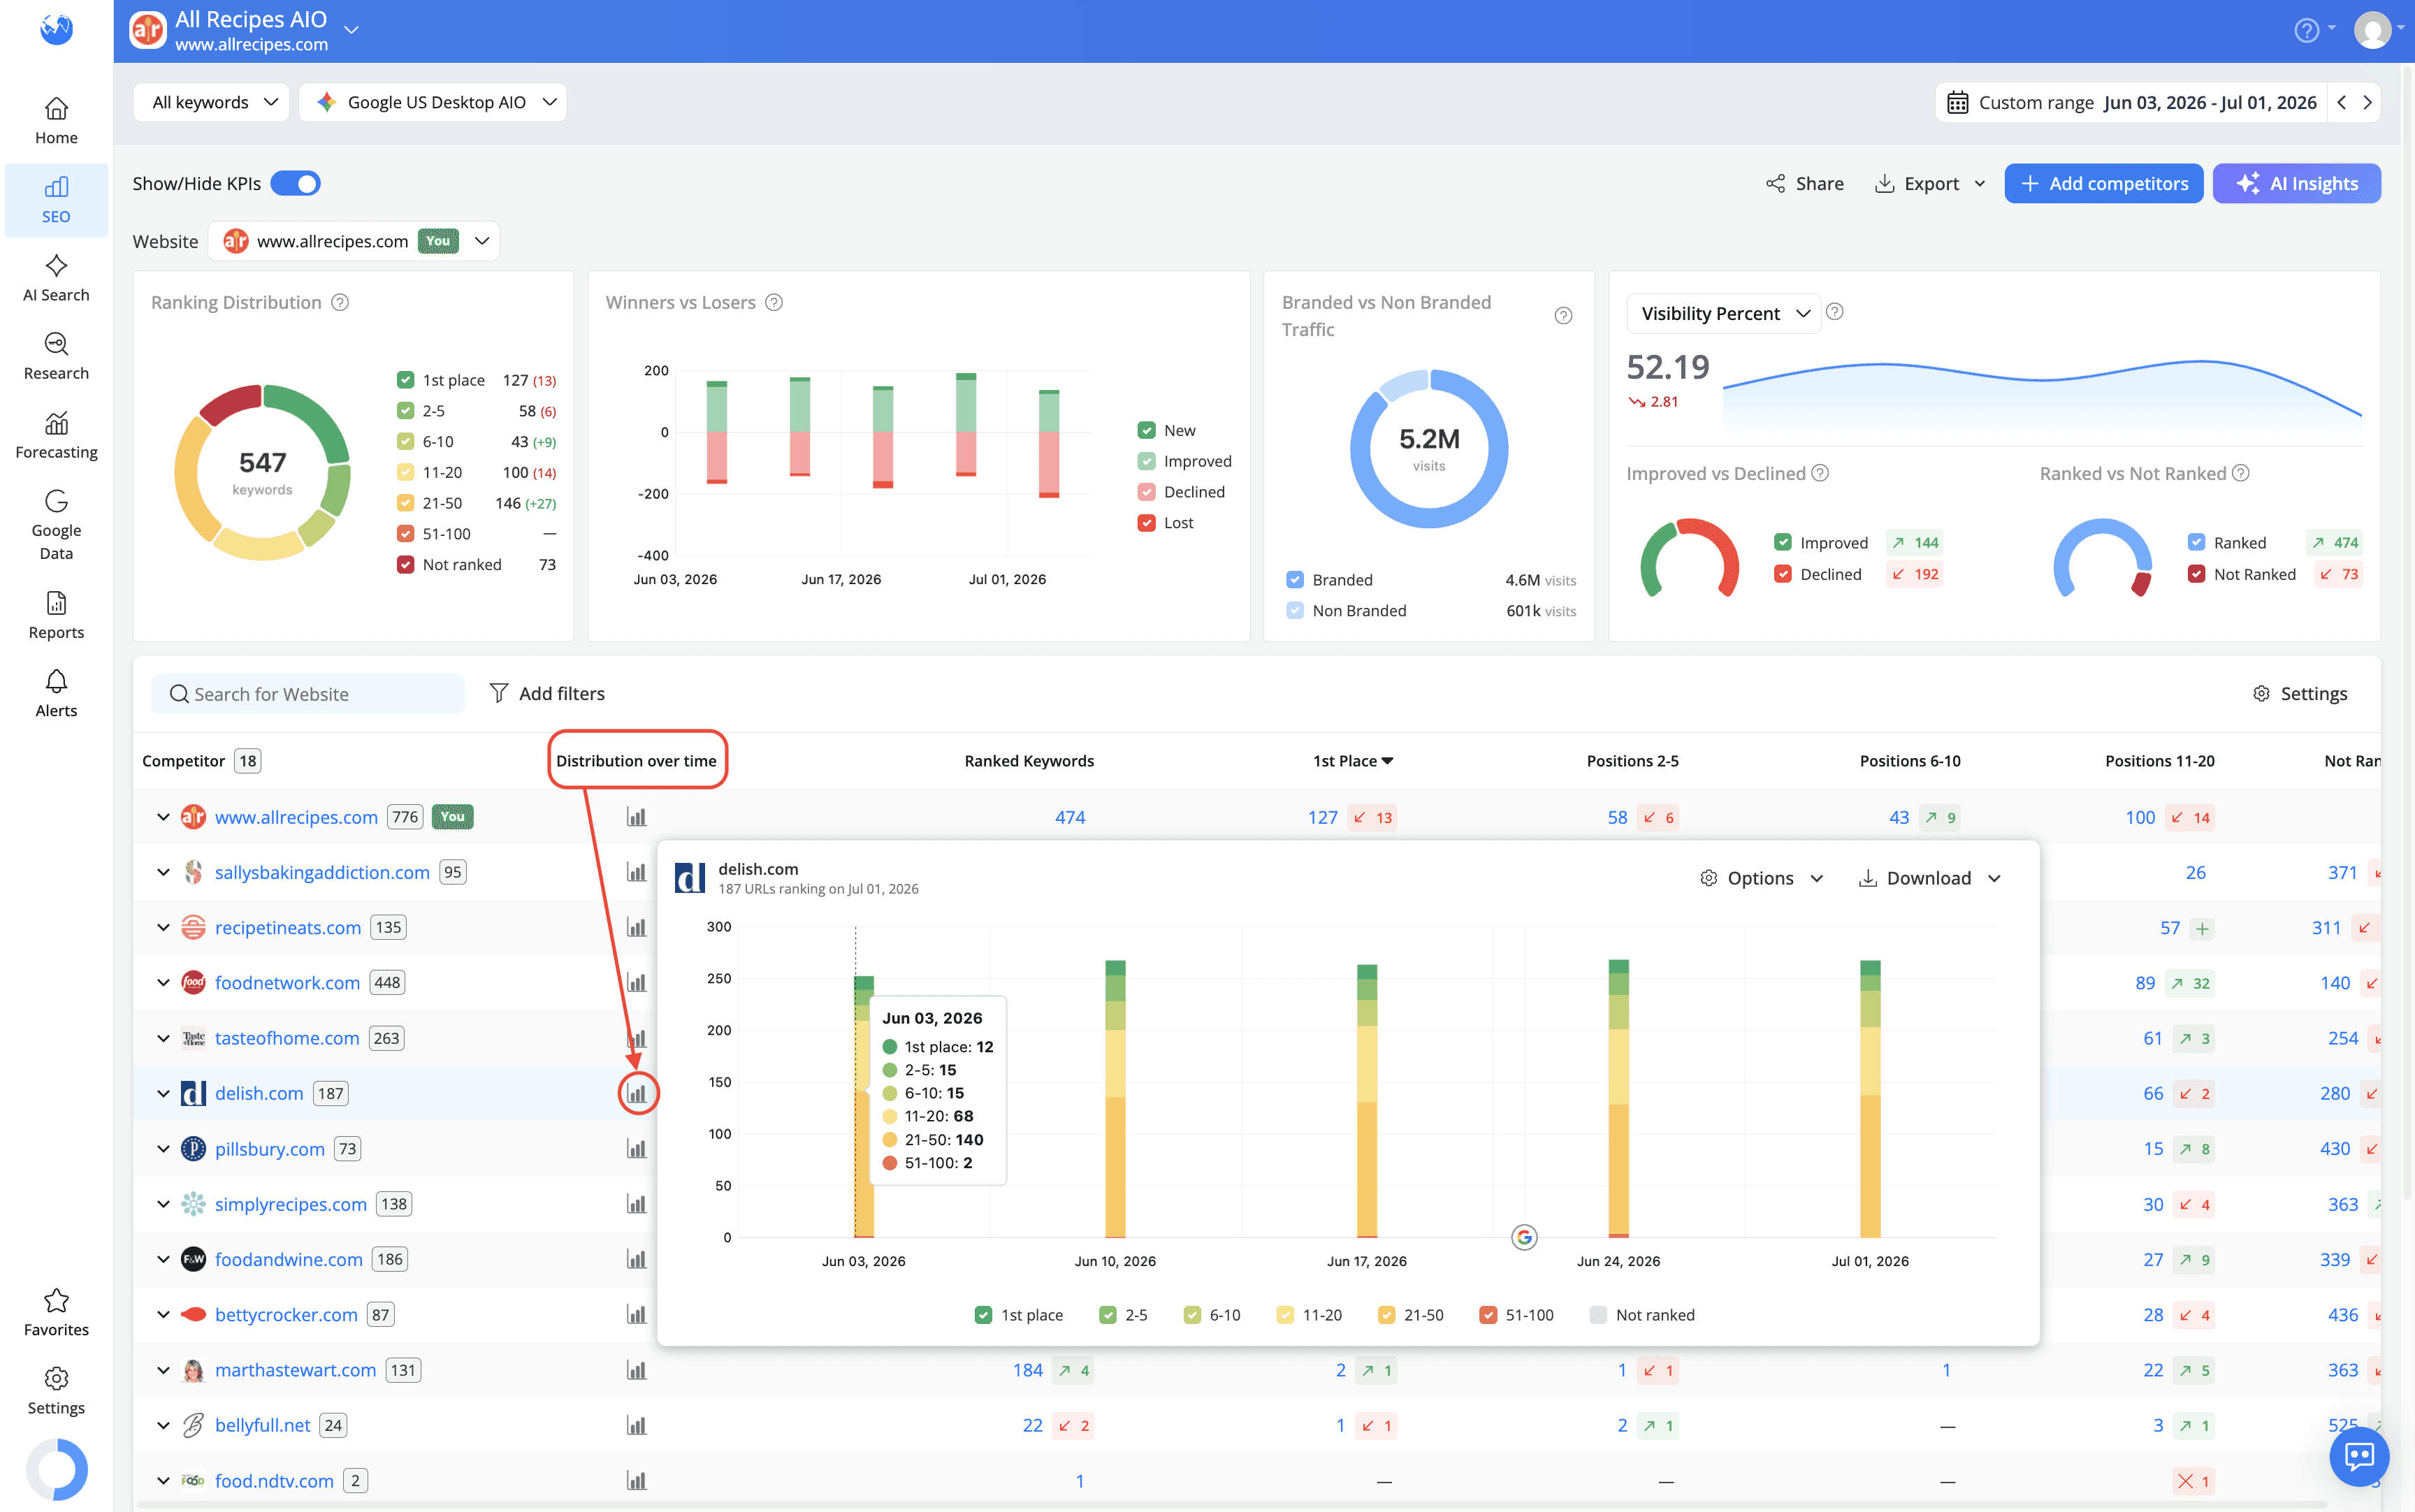
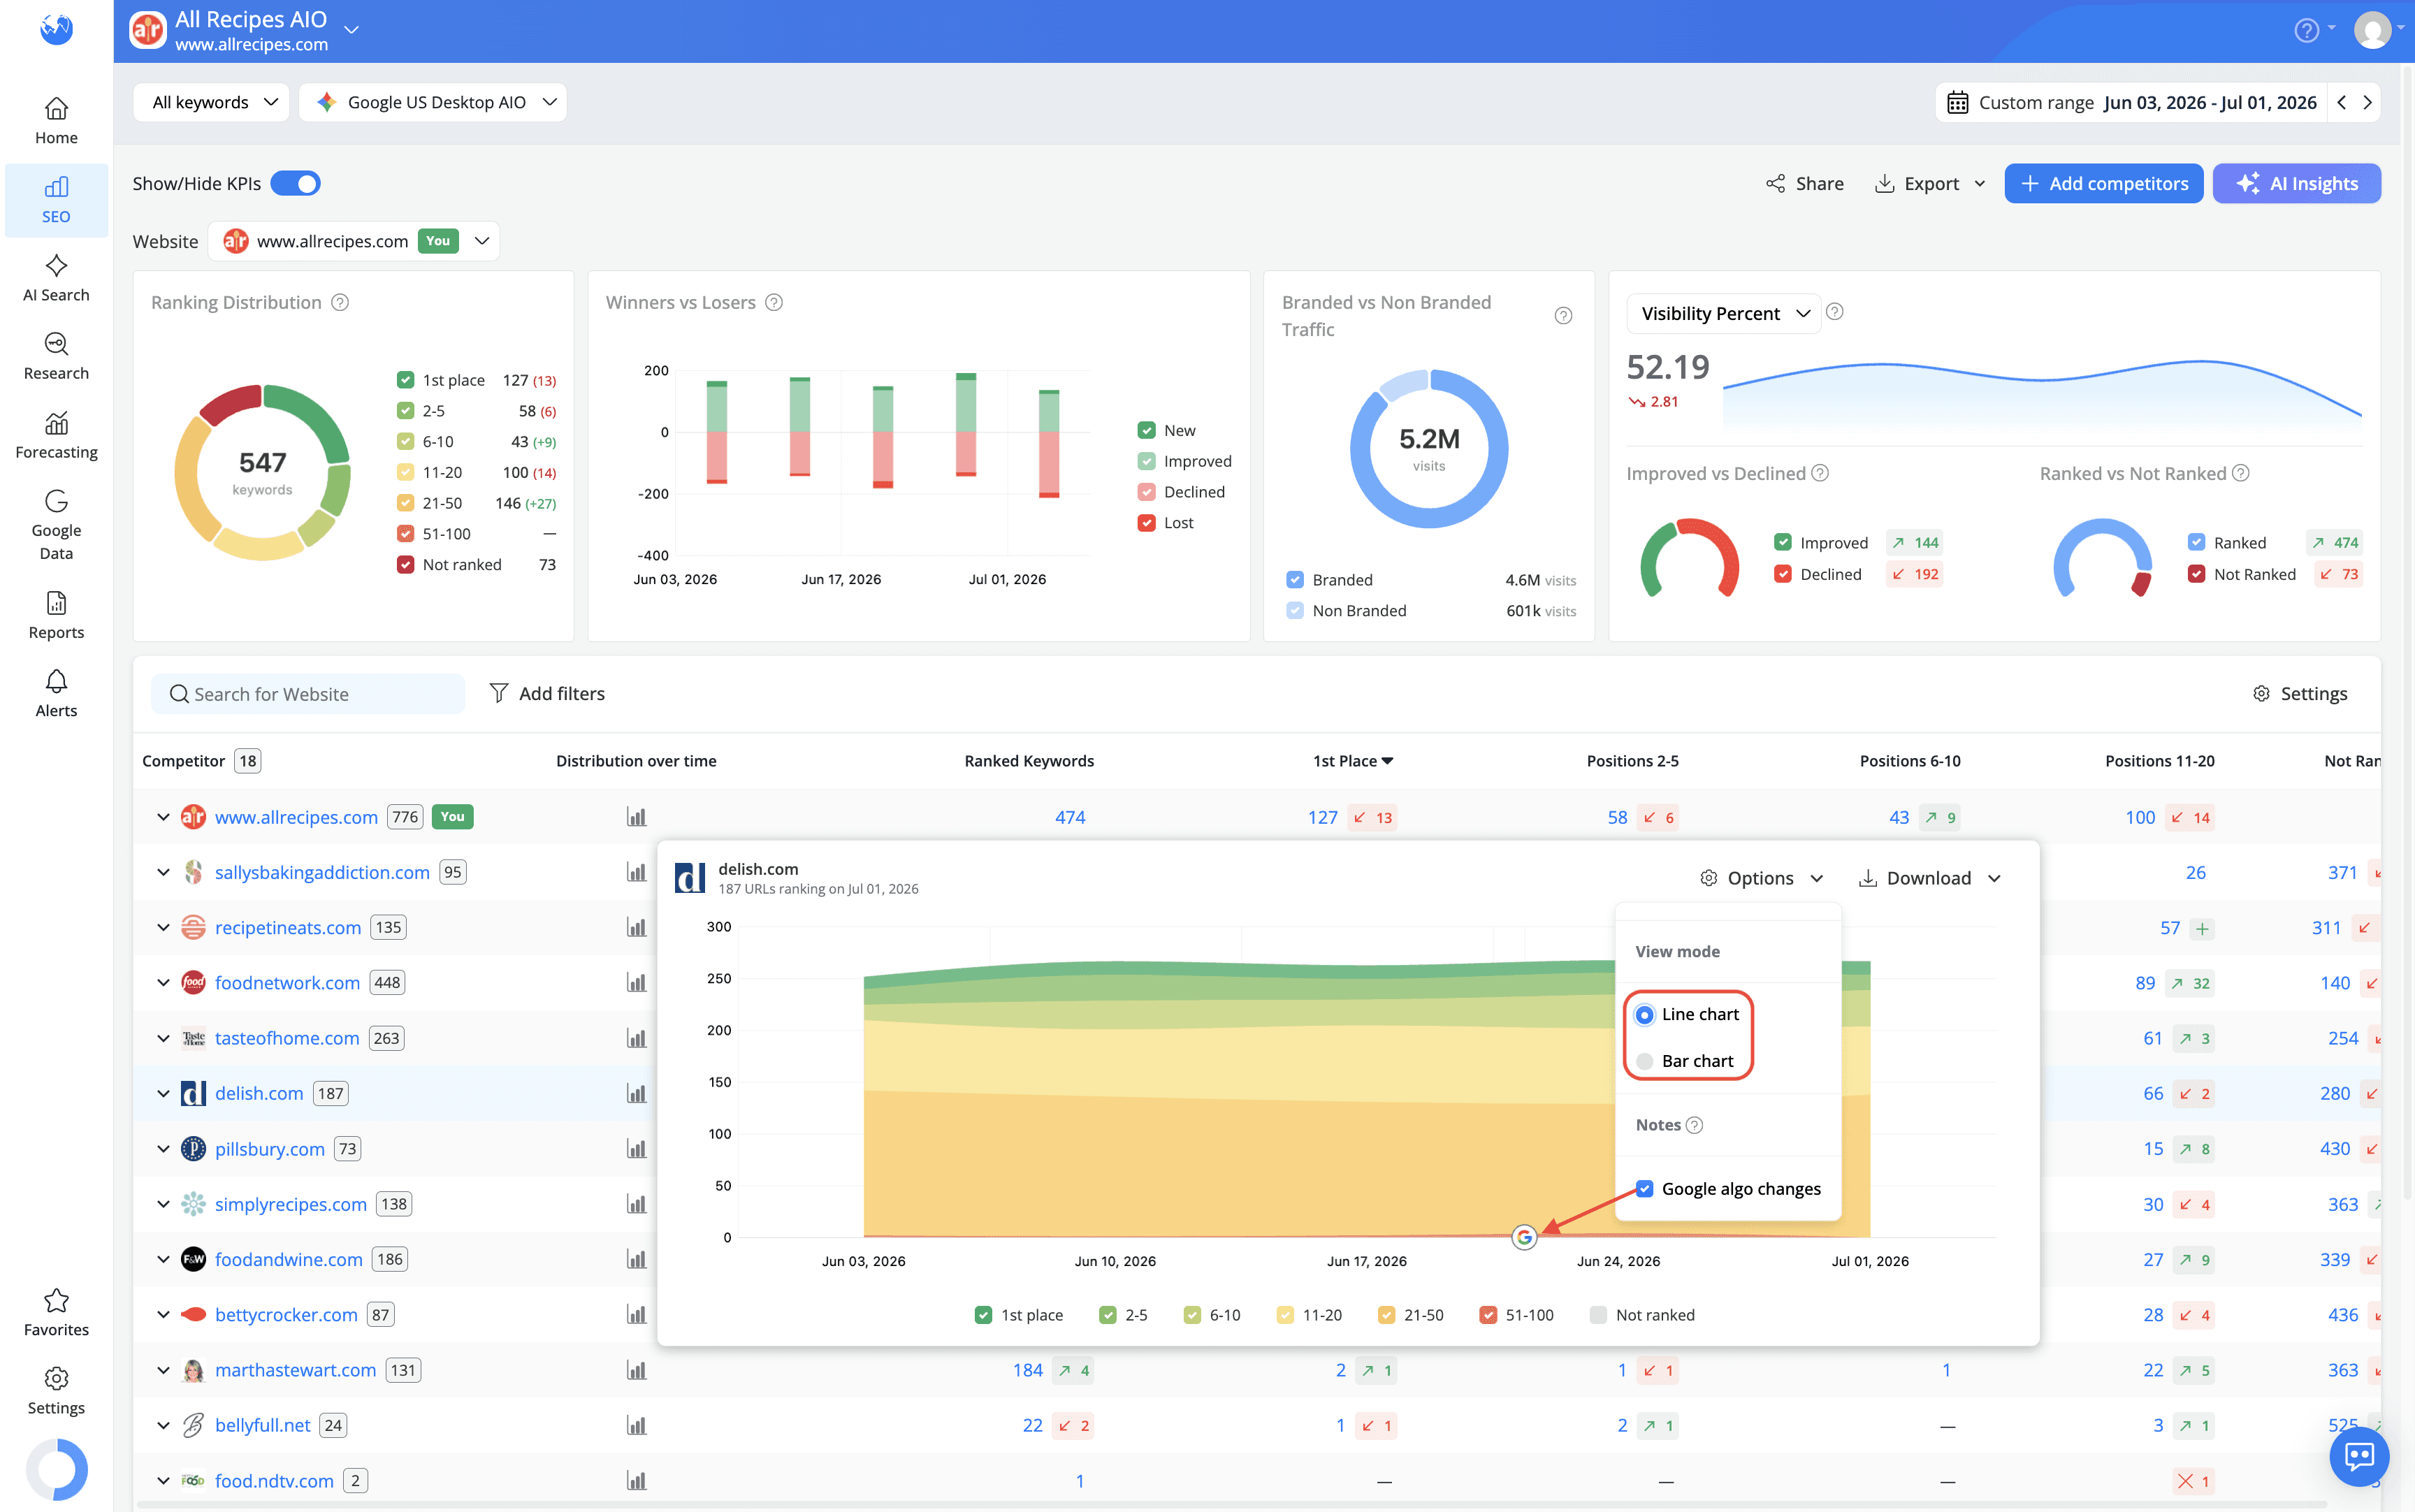
You can switch between a bar chart and a line chart depending on how you want to analyze the data and you can also overlay Google algorithm updates on the same timeline. This makes it easy to see whether changes in your ranking distribution coincide with a known update, without having to compare dates manually.
You don't have to stop at the domain level either. Expand a website's row to see its individual ranked URLs and each one has its own trend icon, showing that specific page's ranking history on its own, separate from the rest of the site.
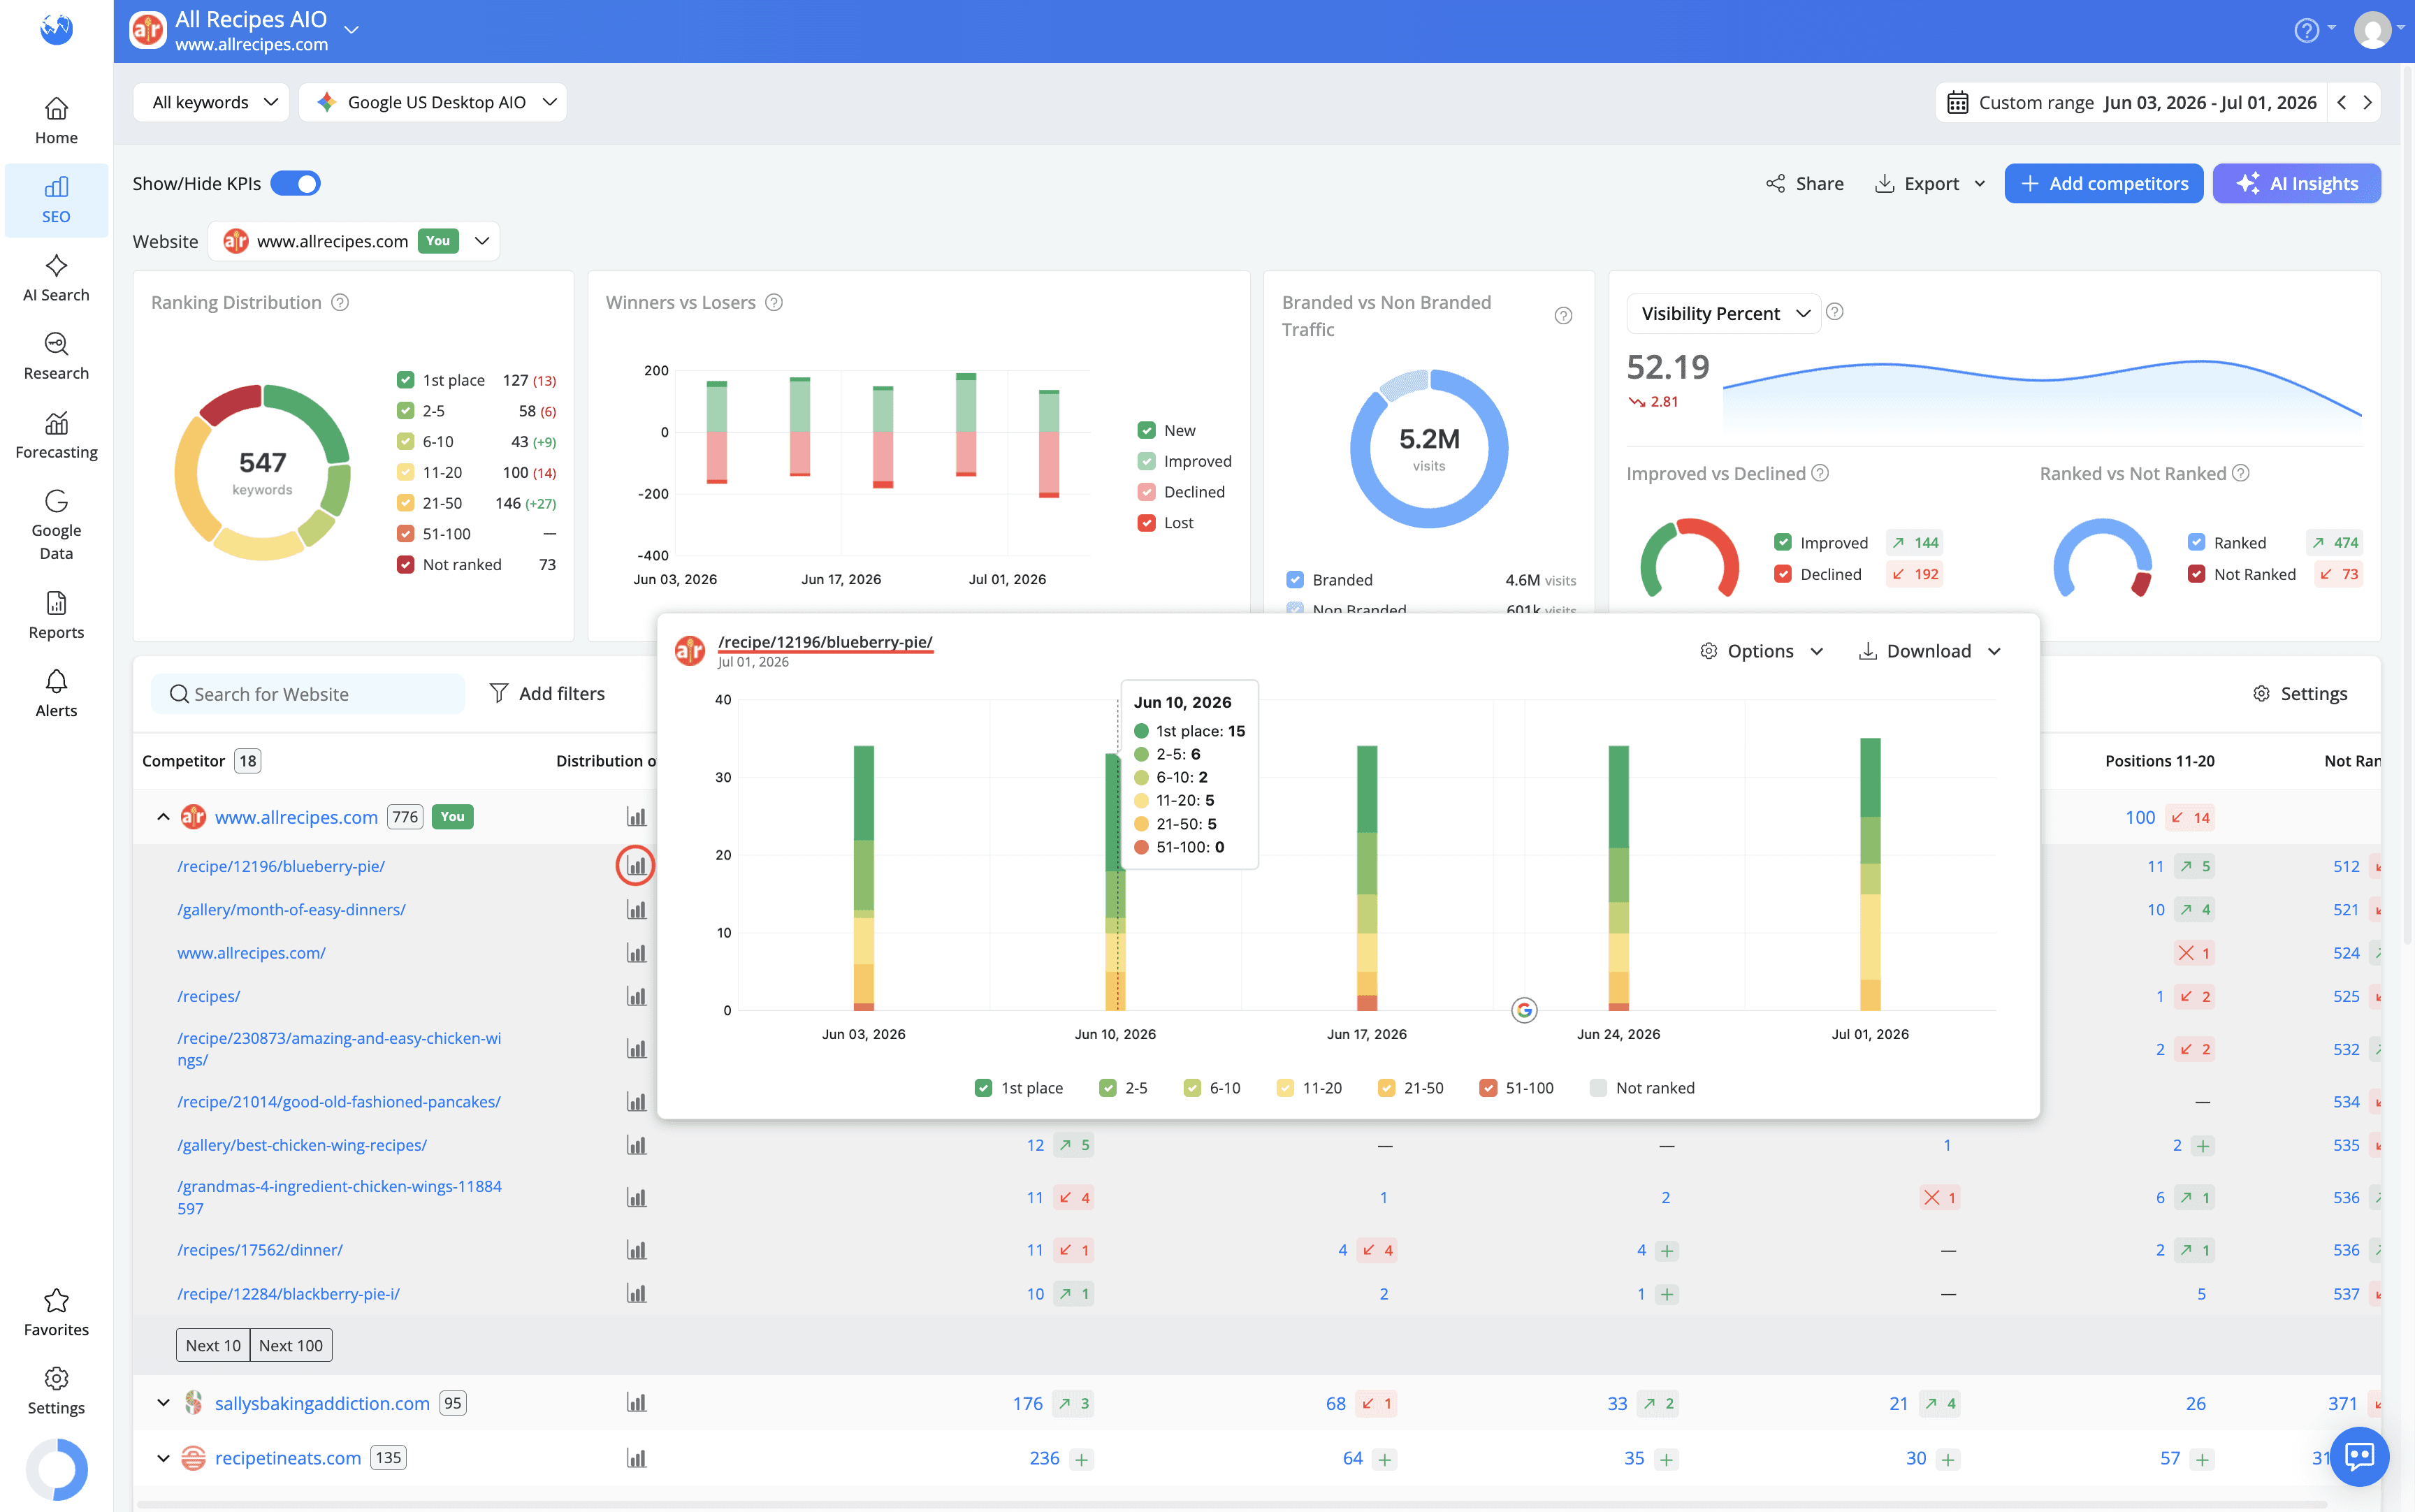
This matters because domain-level trends don't always tell the full story. If your visibility drops, was it spread across the entire site or did one key page lose ground while everything else remained stable? Previously, answering that meant leaving the report and piecing together keyword-level data. Now you can go straight to a landing page, an article or any URL you care about and analyze its ranking distribution over time, using the same chart types and Google algorithm overlay available at the domain level.
It's just as useful for competitor analysis. Instead of comparing only overall performance, you can see whether a competitor's growth is driven by a handful of high-performing pages or by improvements across their entire website. This helps you better understand what's behind their performance and identify where they're gaining visibility.
What's Behind the Numbers in Each Position Range?
Clicking the keyword count within each rankings segment, opens a modal listing all the keywords within that bucket.
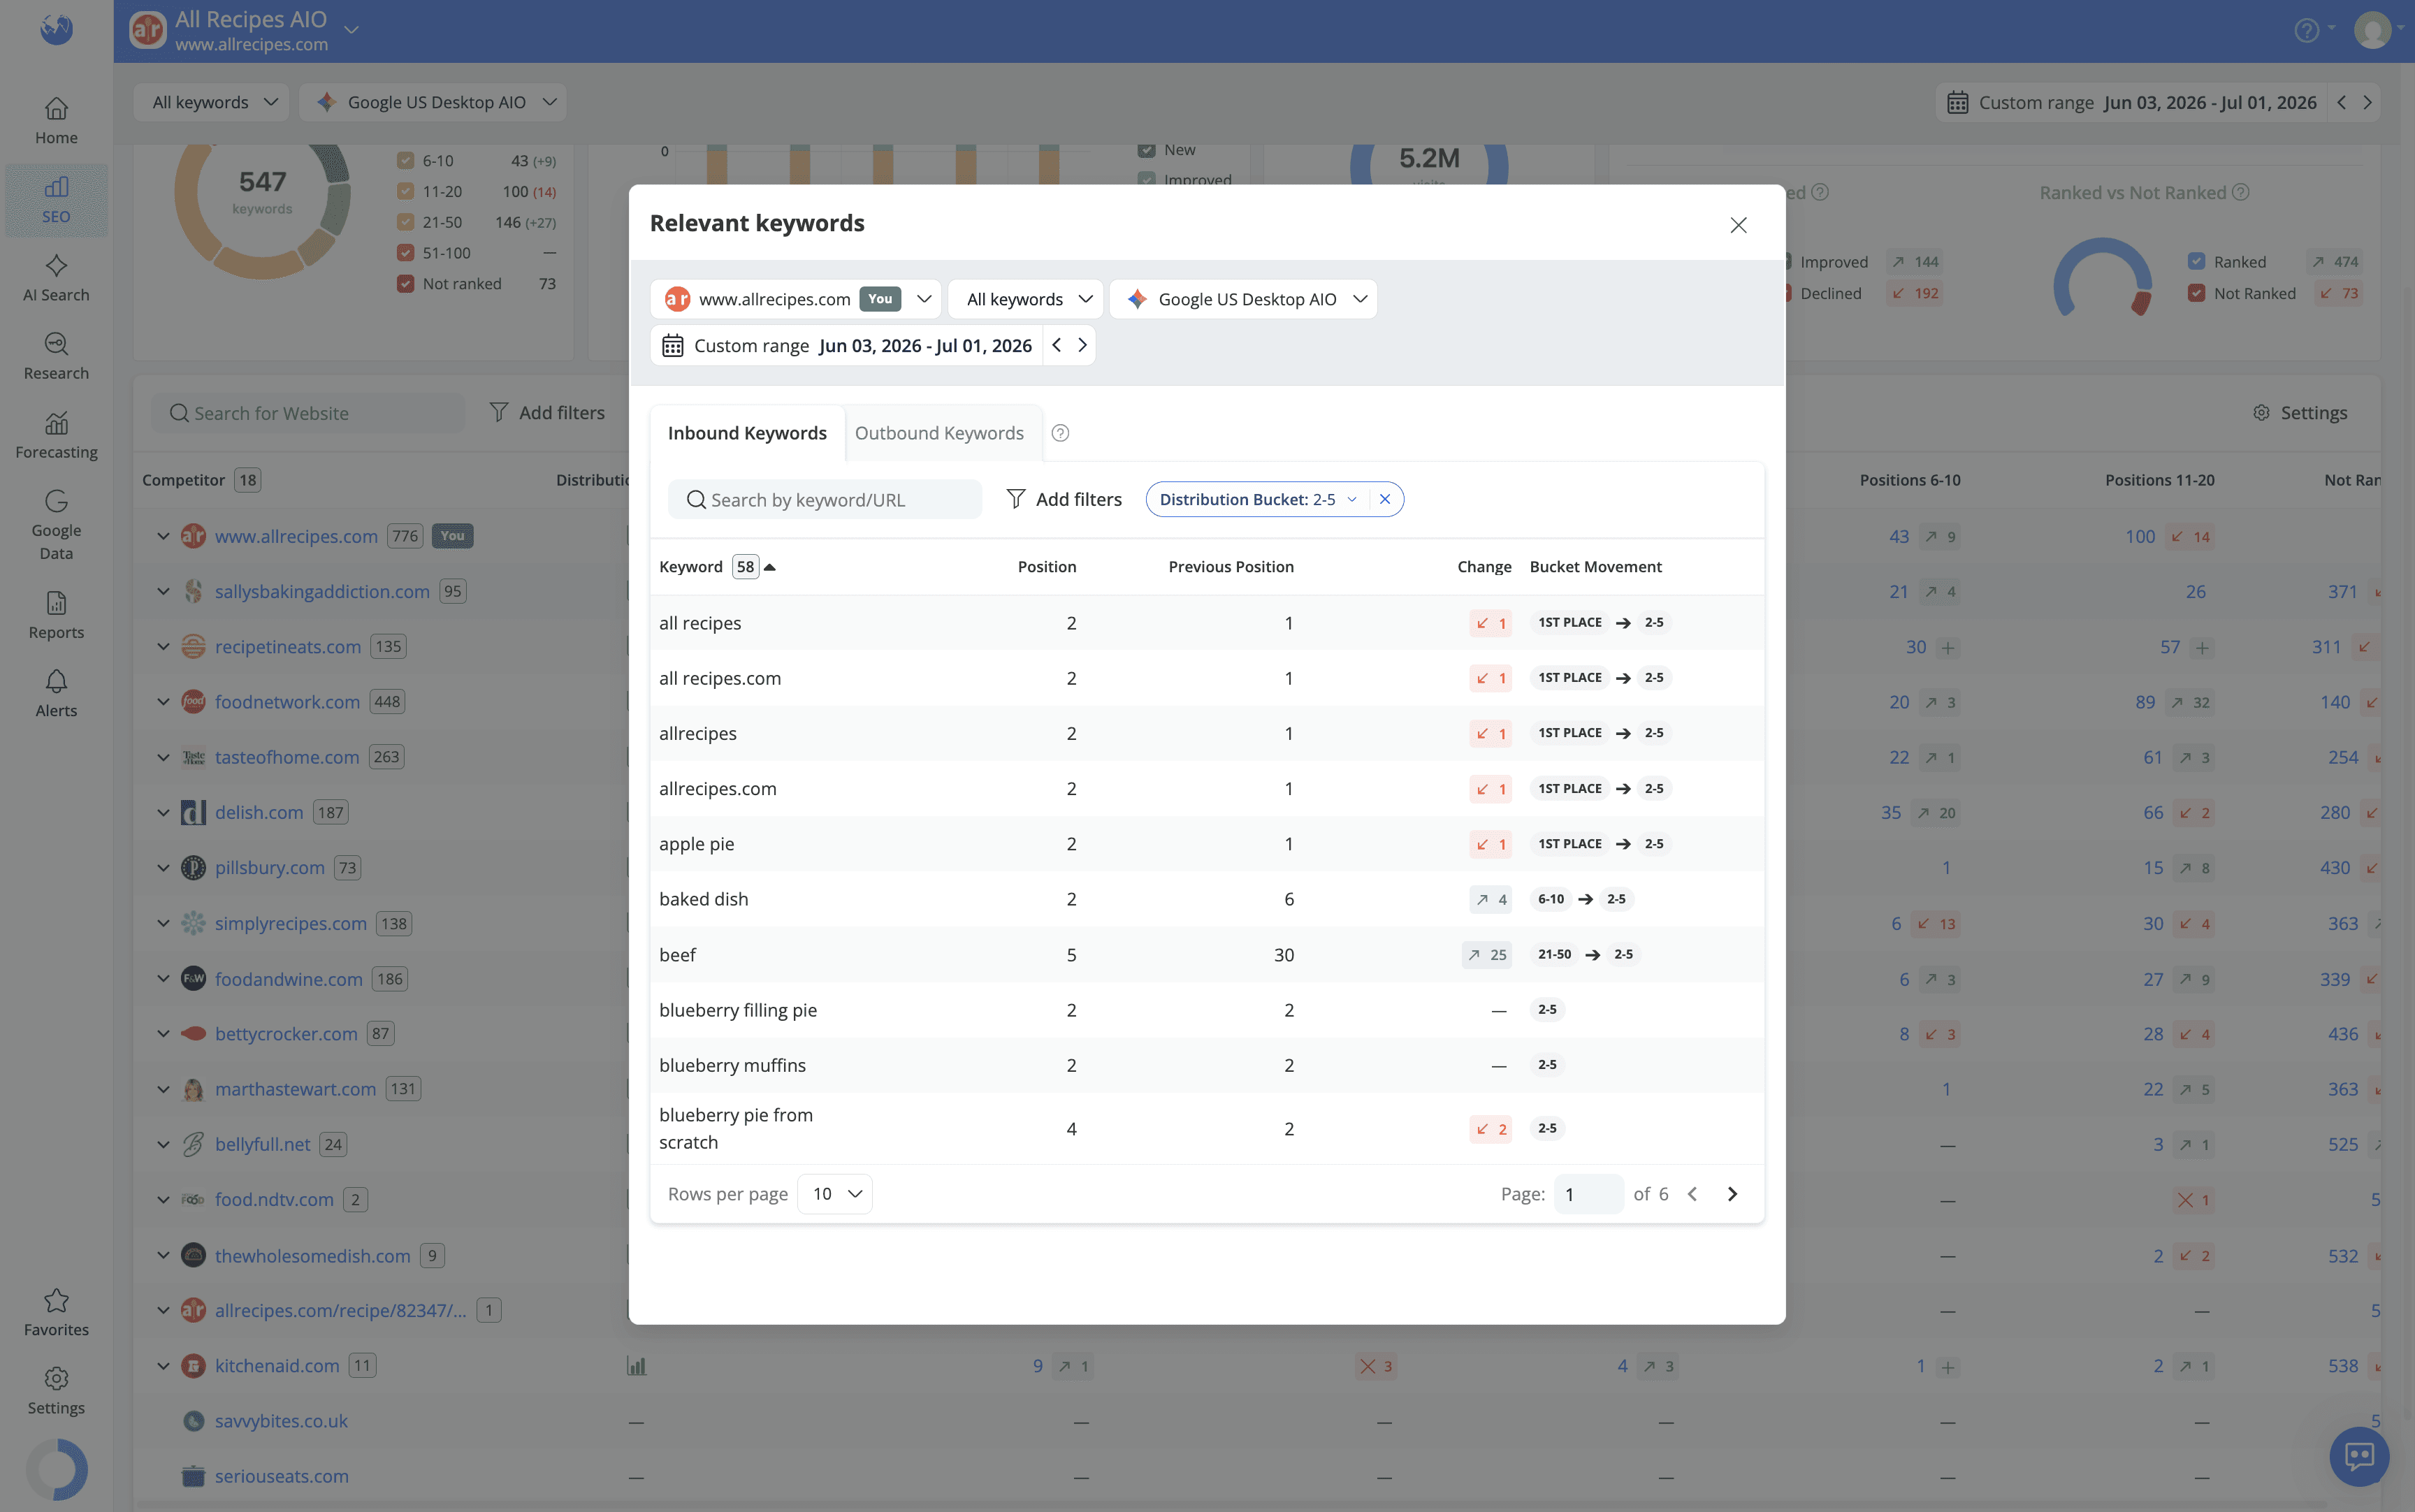
For each keyword, you can see its current position, previous position, the change between them and the position range it moved from or to (for example, 2–5 → 11–20).
The keyword list is split into two tabs:
Inbound Keywords — keywords that entered the selected bucket, either by starting to rank or by moving in from another position range.
Outbound Keywords — keywords that were previously in the selected bucket but have since moved to a different position range.
The benefit is that a bucket count alone only tells you how many keywords are there, not why.
Seeing 141 keywords in positions 2–5 doesn't tell you if that's growth, decline or just churn. Separating inbound and outbound keywords gives you that context, making it easy to identify which keywords are driving gains and which are responsible for declines, without comparing exports or manually tracking position changes.
This is particularly useful after a Google algorithm update or a major website change, when you need to understand whether shifts in your ranking distribution reflect genuine improvements, ranking losses, or simply keywords moving between position ranges. The separate tabs do the sorting for you, saving time and making trend analysis much easier.
Why the Ranking Distribution Report Is Helpful
Rankings rarely move in a straight line. Some keywords climb, others drop, while many stay exactly where they are. A single visibility score or keyword list can't capture that. The Ranking Distribution report shows how your rankings are spread across position ranges, helping you understand where your visibility comes from, where you're making progress and where you're losing ground.
This becomes especially valuable when you need to explain a change in performance, compare your progress with competitors or decide where to focus your optimization efforts next. Are competitors gaining visibility across their entire site or just a few pages? Are your rankings improving because more keywords are breaking into the top 10, or are they simply shifting between lower positions?
With customizable position ranges, trend charts at both the domain and URL level and Inbound and Outbound keyword analysis, the Ranking Distribution report gives you the context behind the numbers, making it easier to spot trends, identify opportunities and understand what's really driving your SEO performance.
Wrapping Up
SEO is about more than knowing where your keywords rank. It's about understanding how those rankings change, identifying where your optimization efforts are making an impact, and knowing where to focus your attention next.
With these enhancements, the Ranking Distribution report makes it easier to uncover the story behind your rankings, so you can spend less time interpreting data and more time making informed SEO decisions.
Do you have any further questions or need more information about this product update? Don't hesitate to get in touch with our dedicated support team.
Frequently Asked Questions
What is the Ranking Distribution report in AWR?
Can I choose which websites appear in the Ranking Distribution table?
What's the difference between Inbound and Outbound keywords in AWR?
Can I track ranking distribution trends for a single URL, not just the whole website?
Can I see if a ranking change coincides with a Google algorithm update?
stay in the loop