

Advice and answers from the Advanced Web Ranking Team
Search for articles
Meet the Questions Report: Turn People Also Ask into a Content Roadmap
Track every People Also Ask question Google shows for your keywords, see who's answering it and turn the gaps into a content roadmap with AWR's Questions report.

Every time Google shows a People Also Ask box for one of your tracked keywords, it gives you a question your audience is actively searching for and an opportunity to provide the answer. The challenge is that these questions are usually scattered across individual keyword reports, making them easy to overlook and difficult to act on.
AWR’s new Questions report brings all of these questions together in one place. It automatically collects the questions related to your tracked keywords, groups them by topic to make common themes easier to spot, and shows which websites are currently answering them. This makes it easier to find gaps in your content, see where competitors are already gaining visibility and focus on the questions where you have an opportunity to be featured.
What this article covers
Why questions deserve a report of their own
Search has been shifting toward questions for years, and the People Also Ask (PAA) box is one of the clearest examples of this change. Backlinko’s user behavior research found PAA boxes on roughly 43% of Google results pages, while an analysis cited in Search Engine Land’s PAA guide found that 86% of queries that trigger a PAA box are explicitly question based. The same guide reports that PAA visibility in the US increased by more than a third between February 2024 and January 2025.
The takeaway is simple: questions are becoming a bigger part of the SERP, creating more opportunities for content to answer them and appear in front of users. If your content strategy does not account for these questions, you may be missing opportunities to reach your audience.

There’s another reason to pay attention to PAA and it’s a more recent one. Questions are becoming an important link between traditional SEO and AI search.
Semrush’s AI Overviews study found that People Also Ask appears on 90% of SERPs that contain an AI Overview.
Our own study of 8,000 keywords also found that queries most likely to trigger an AI Overview tend to be longer, more specific and often include question terms such as “how.”
As Mark Williams Cook explains in our interview on reading search signals, PAA questions can also reveal the follow up intents that AI systems expand queries into. They show you “what people were asking that nobody else was answering.”
Until now, AWR treated PAA like the other 30+ SERP features. You could see whether a People Also Ask box appeared for a keyword and whether your website ranked inside it.
The Questions report takes a different approach. Rather than starting with keywords, it starts with the questions themselves, bringing together every unique question Google surfaces across your tracked SERPs and organizing them into a format you can actually use.
The Questions report at a glance
You’ll find Questions under SERP Analysis in the SEO section.

You can view the questions for your entire tracked keyword set or narrow them down to one or more specific keyword groups. You can also change the search engine and date range to explore the questions for different tracking setups and periods.

The report updates within a few seconds whenever you change these selections, making it easy to quickly explore the questions associated with your tracked keywords.
The layout is simple: three KPI cards at the top and beneath them a table where each row is a question Google showed for at least one of your tracked keywords. Let's take a closer look at each one.
The KPI Cards
Total questions - how many questions your keywords generate

Total questions counts the unique People Also Ask questions Google showed for your tracked keywords during the selected date range. The breakdown bar shows how these questions are distributed across topics, branded questions, which are identified using your brand names and domain aliases, and uncategorized questions that did not cluster into a specific theme.
In the example above, 547 tracked keywords generated 4,725 unique questions across 516 topics. That means the keyword set resulted in more than eight times as many unique questions, which is not unusual. Each SERP can contain several PAA questions and larger or more specific keyword sets can quickly expand into a much broader set of questions.
The chart is also interactive, so you can use it to explore the data rather than simply view it. Click any bar to narrow the report down to that topic or enable Show competitor answers to see how many questions in each topic are already being answered by competitors.
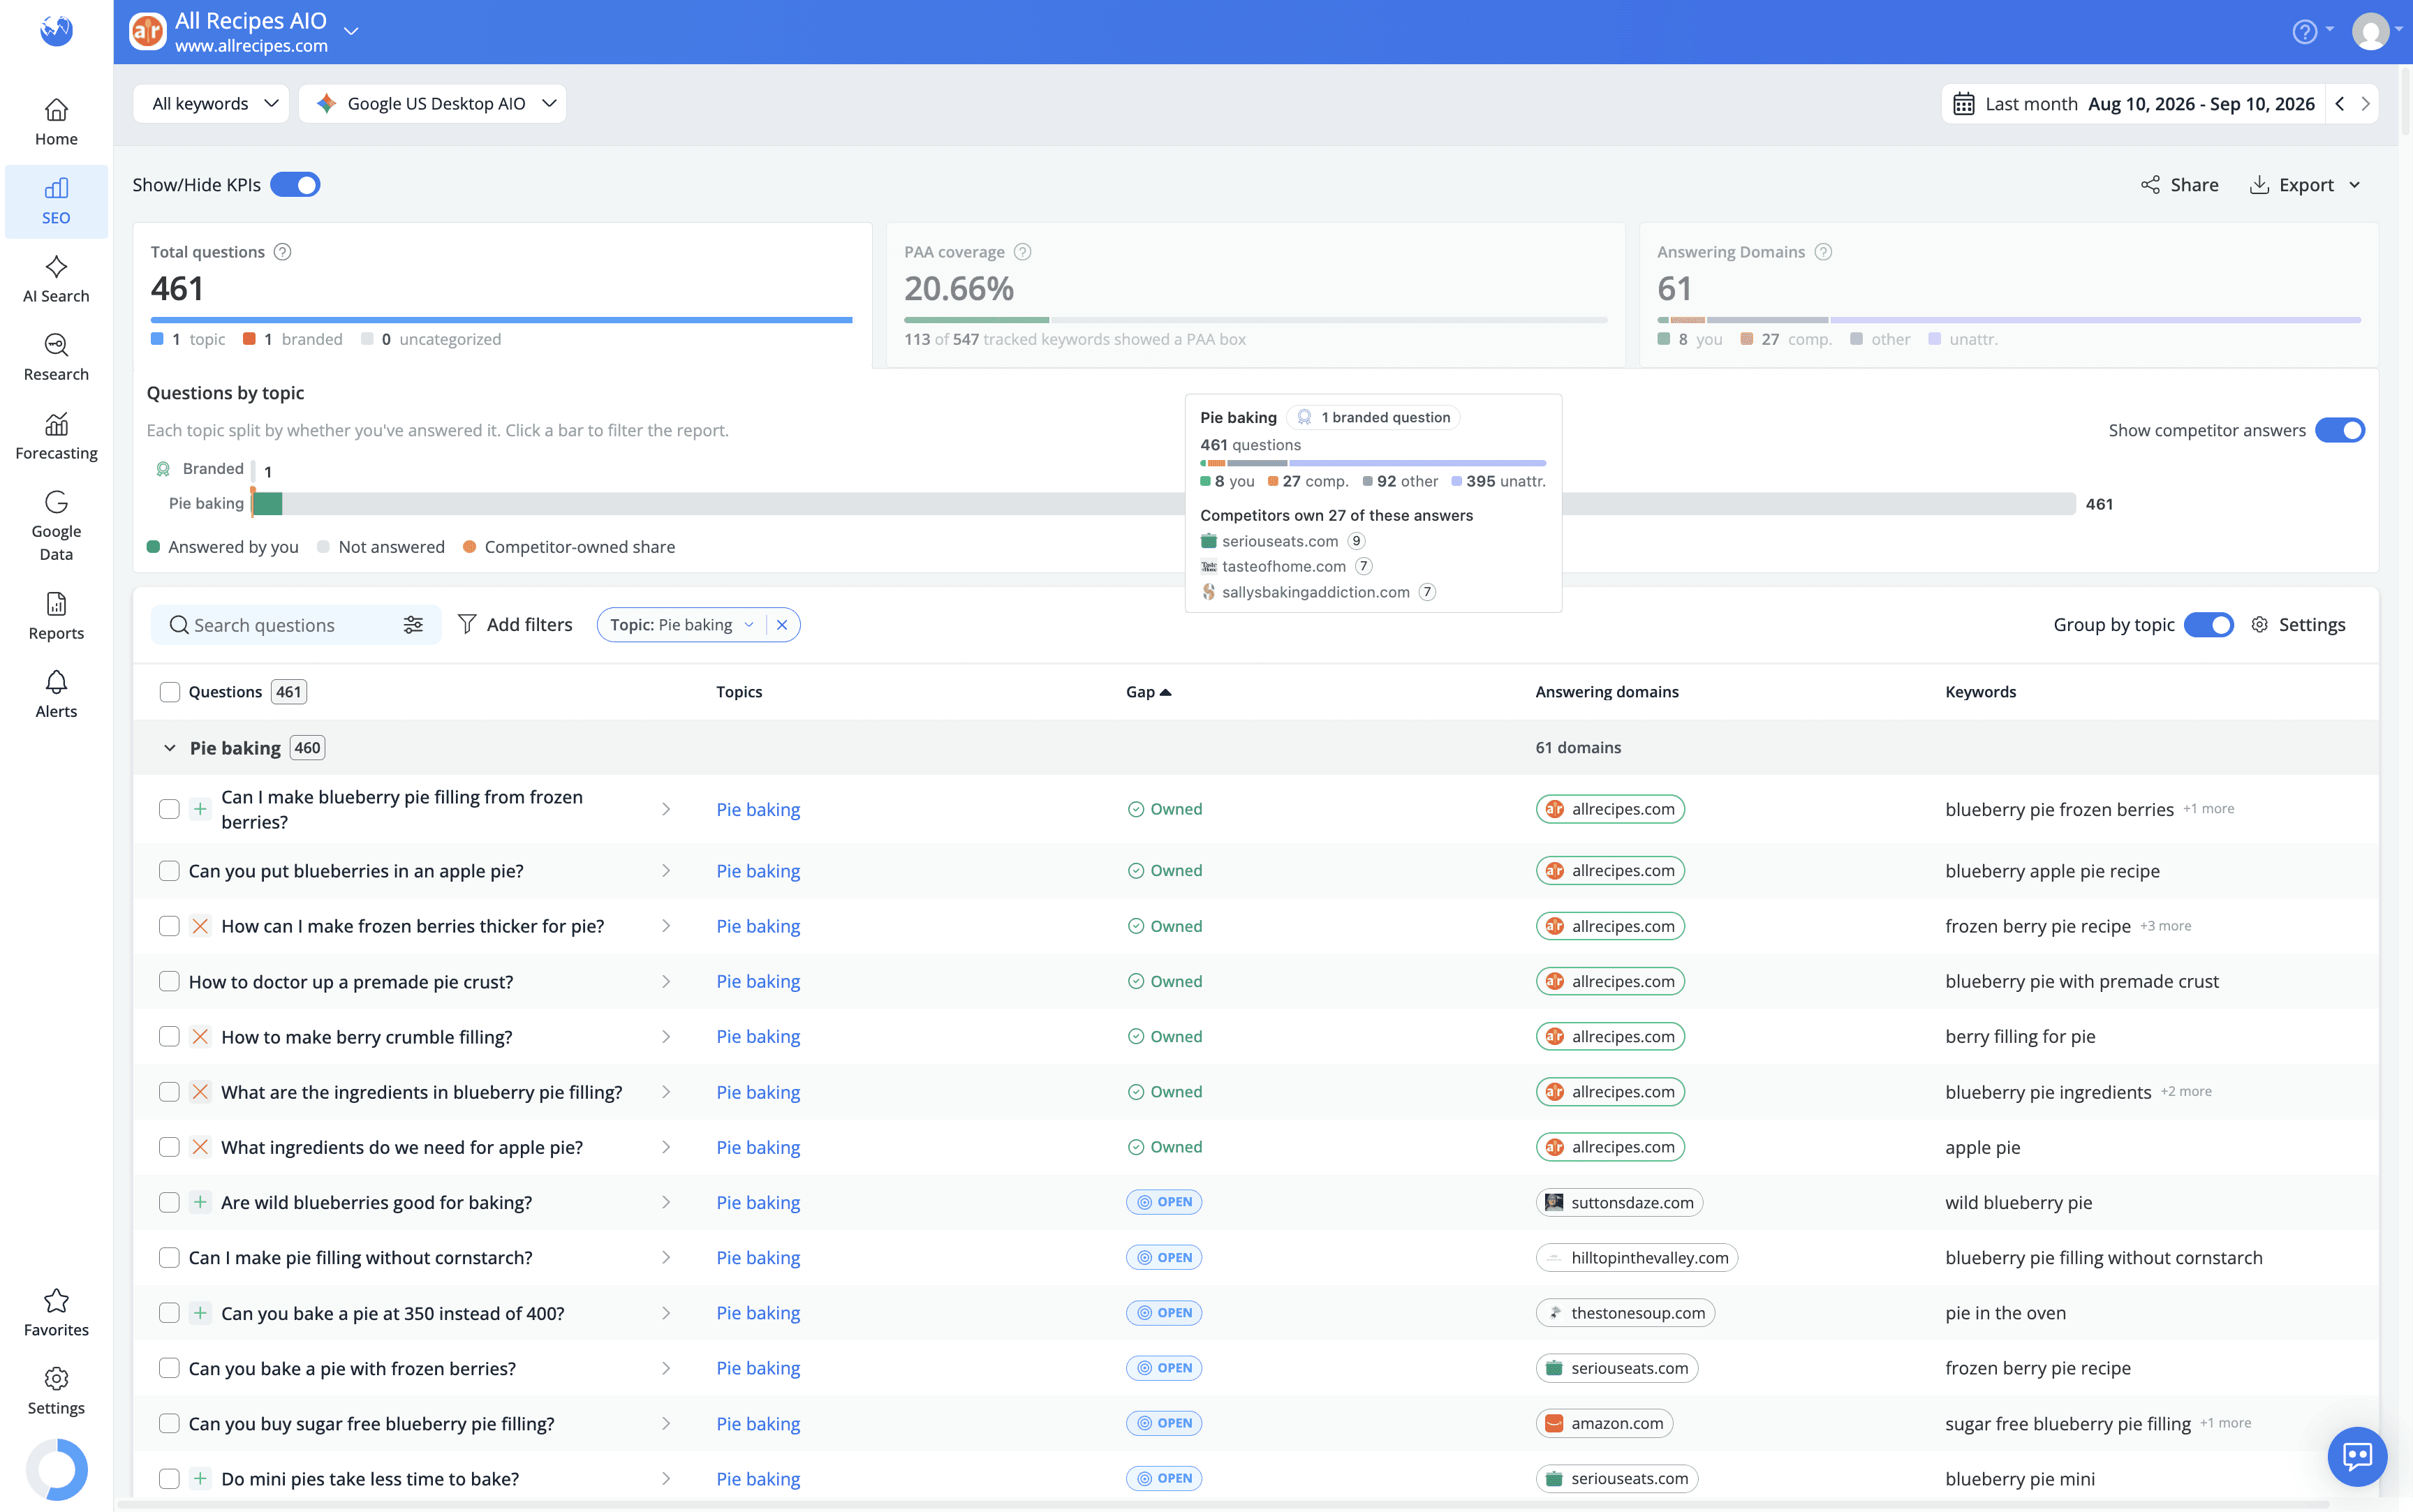
The Uncategorized bar includes questions that could not be grouped into an existing theme, so they remain part of the report instead of being left out.

PAA coverage - how often your keywords trigger PAA
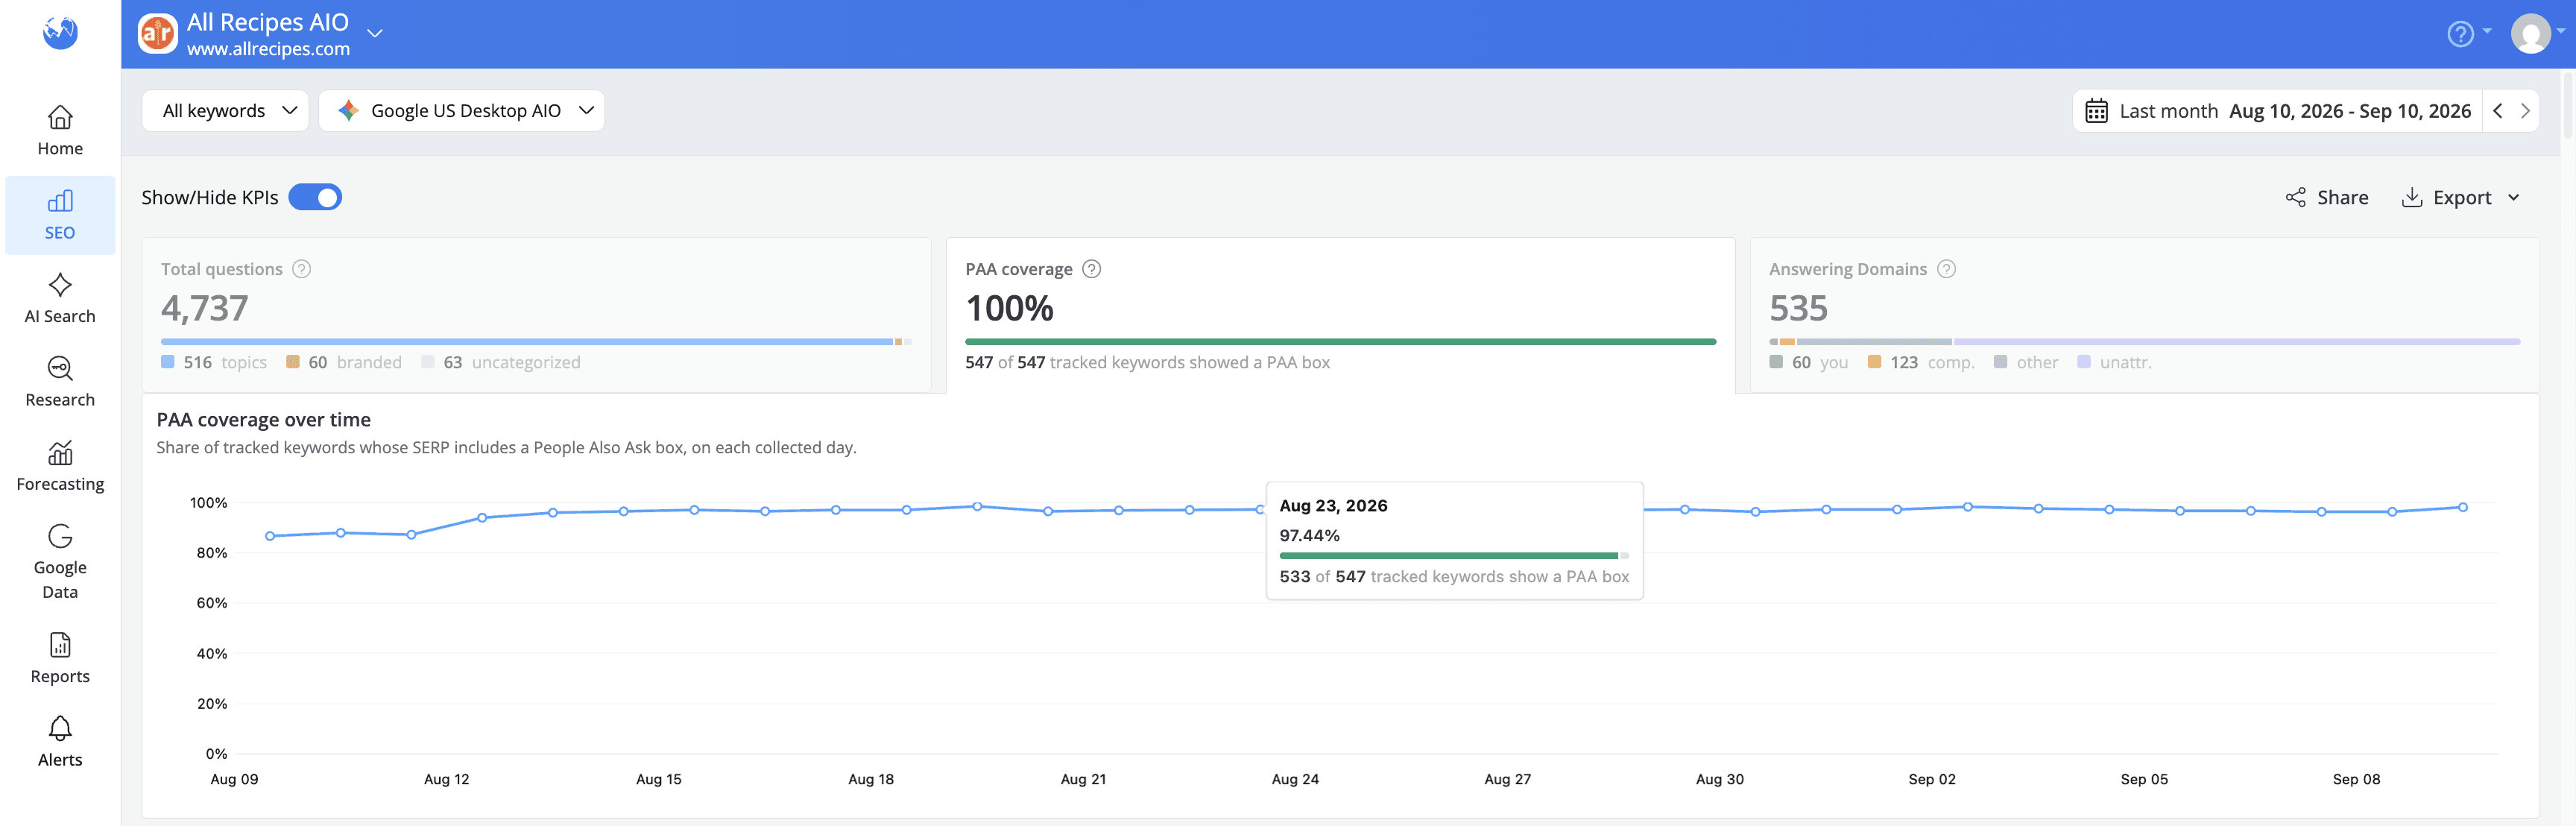
PAA coverage is the share of your tracked keywords that returned a People Also Ask box at any point in the selected date range. The higher the coverage, the more of your keyword set is associated with questions that you can potentially target with your content.
When you expand the card, you can see how PAA coverage changed across each collected day. This makes it easier to spot changes in how often Google shows PAA boxes for your tracked keywords, including shifts caused by Google tests or changes to the SERP.
Answering Domains - which websites are answering these questions
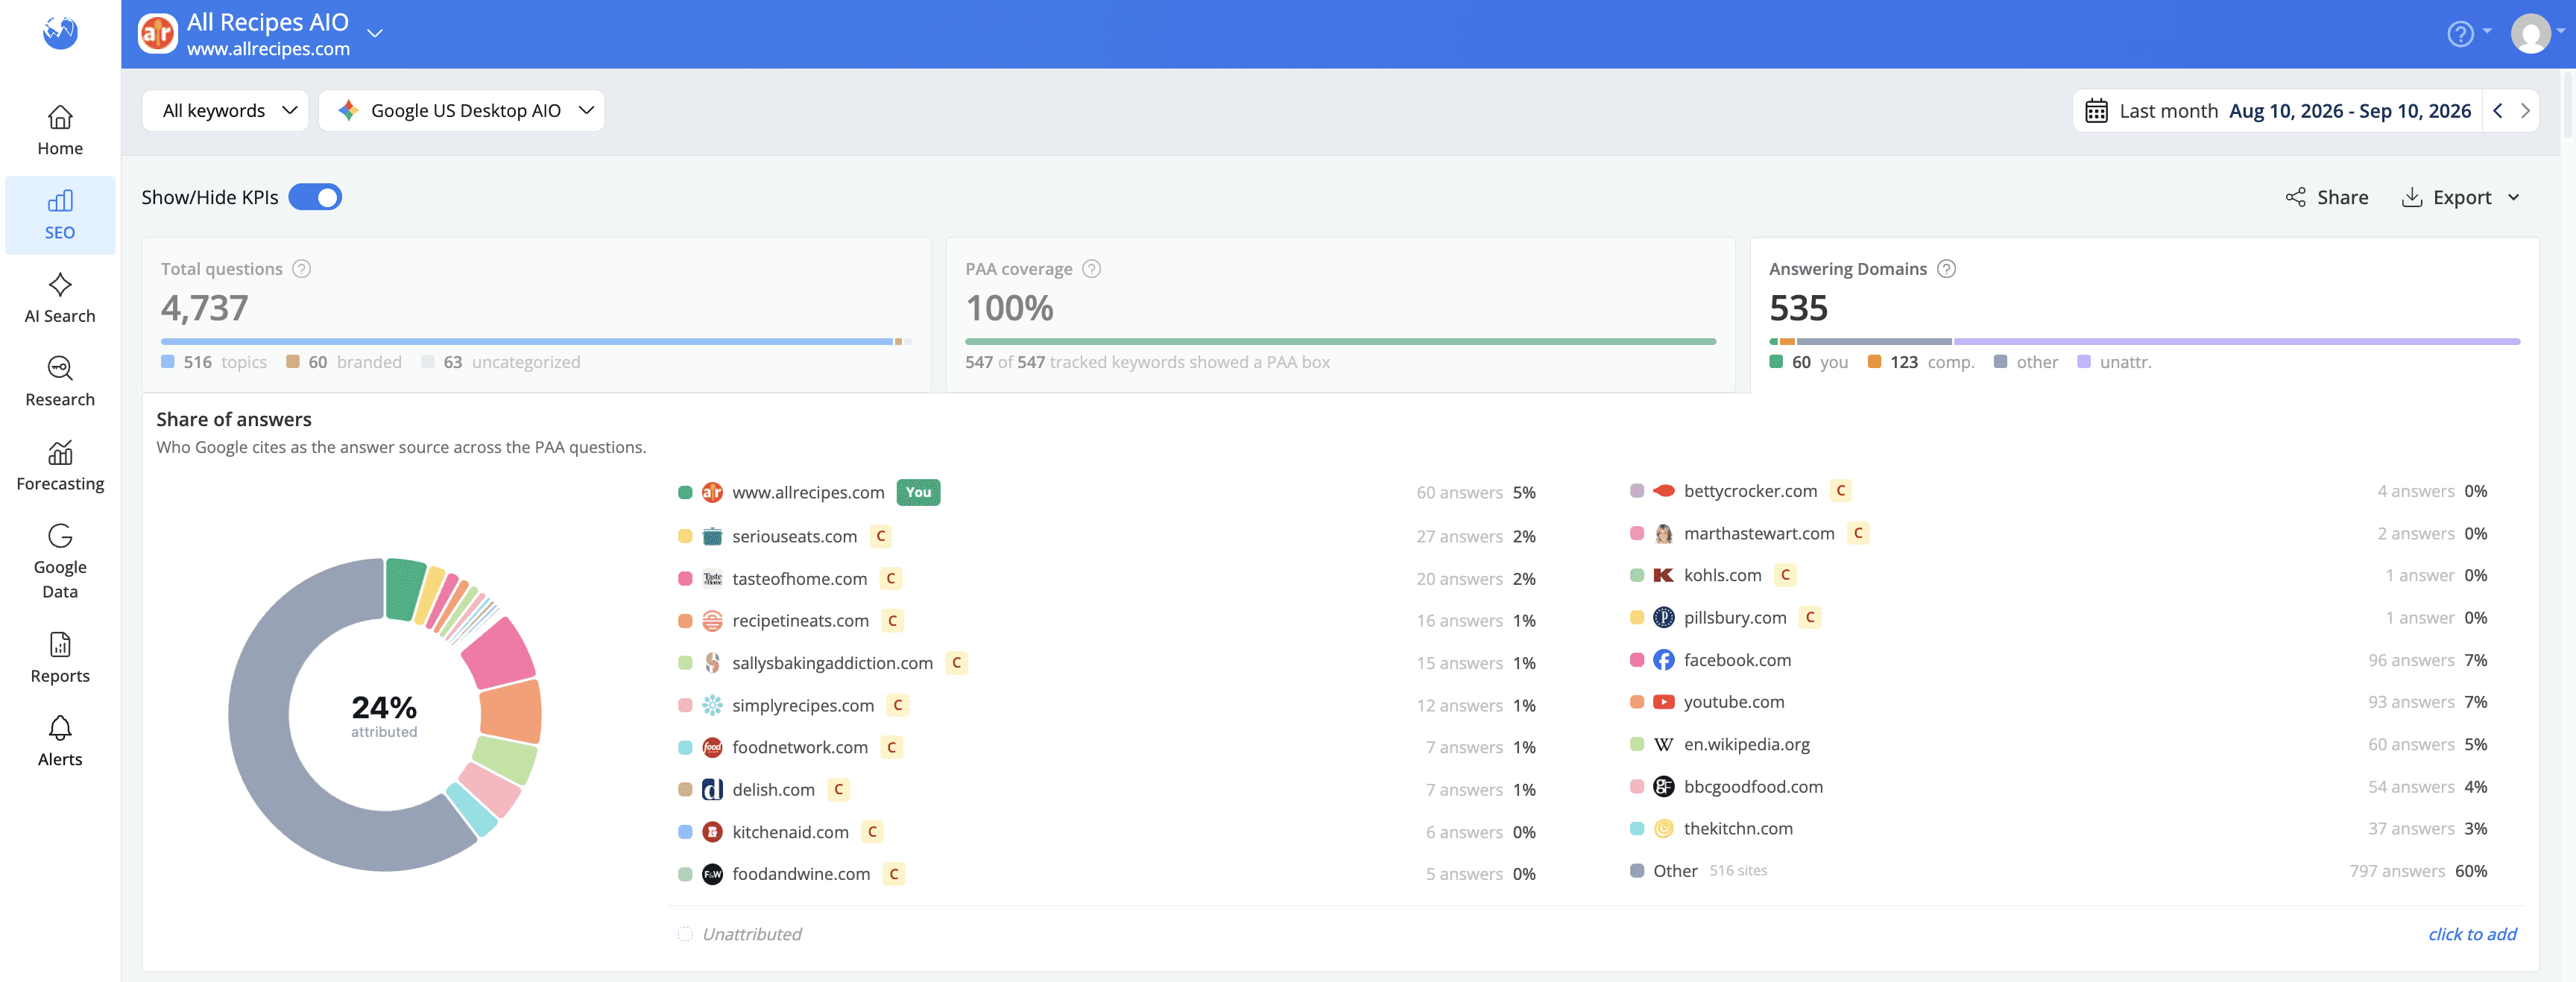
Answering Domains counts the distinct domains Google cited as the answer source across the PAA questions in your report's date range. The bar splits every answer by owner: you, your tracked competitors, other websites, and unattributed, meaning questions whose answer URL hasn't been parsed yet.
When you expand the card, you’ll see the Share of answers donut chart, which shows how the attributed answers are distributed across domains. This gives you a quick view of which websites are most frequently cited for the questions in your tracked SERPs.
This can help you understand which websites are gaining visibility in PAA and where your own content stands. In the example above allrecipes.com, the tracked site, accounts for 5% of the attributed answers. The larger share belongs to Other, with 516 different domains collectively accounting for 60% of the answers. This shows that answer ownership is spread across a wide range of websites rather than concentrated among a few major players.
You can also use this view to spot websites that frequently appear as answer sources but are not yet part of your competitor tracking.
The question table - analyze topics and content gaps

Below the KPI cards, the Question table brings all the collected questions together for a more detailed analysis. With Group by topic enabled, questions are organized into topic clusters. Each group also shows how many domains are answering questions within that topic.
Turn grouping off to switch to a flat, sortable list of individual questions.
You can choose which columns are displayed and change their order using the Table Settings.
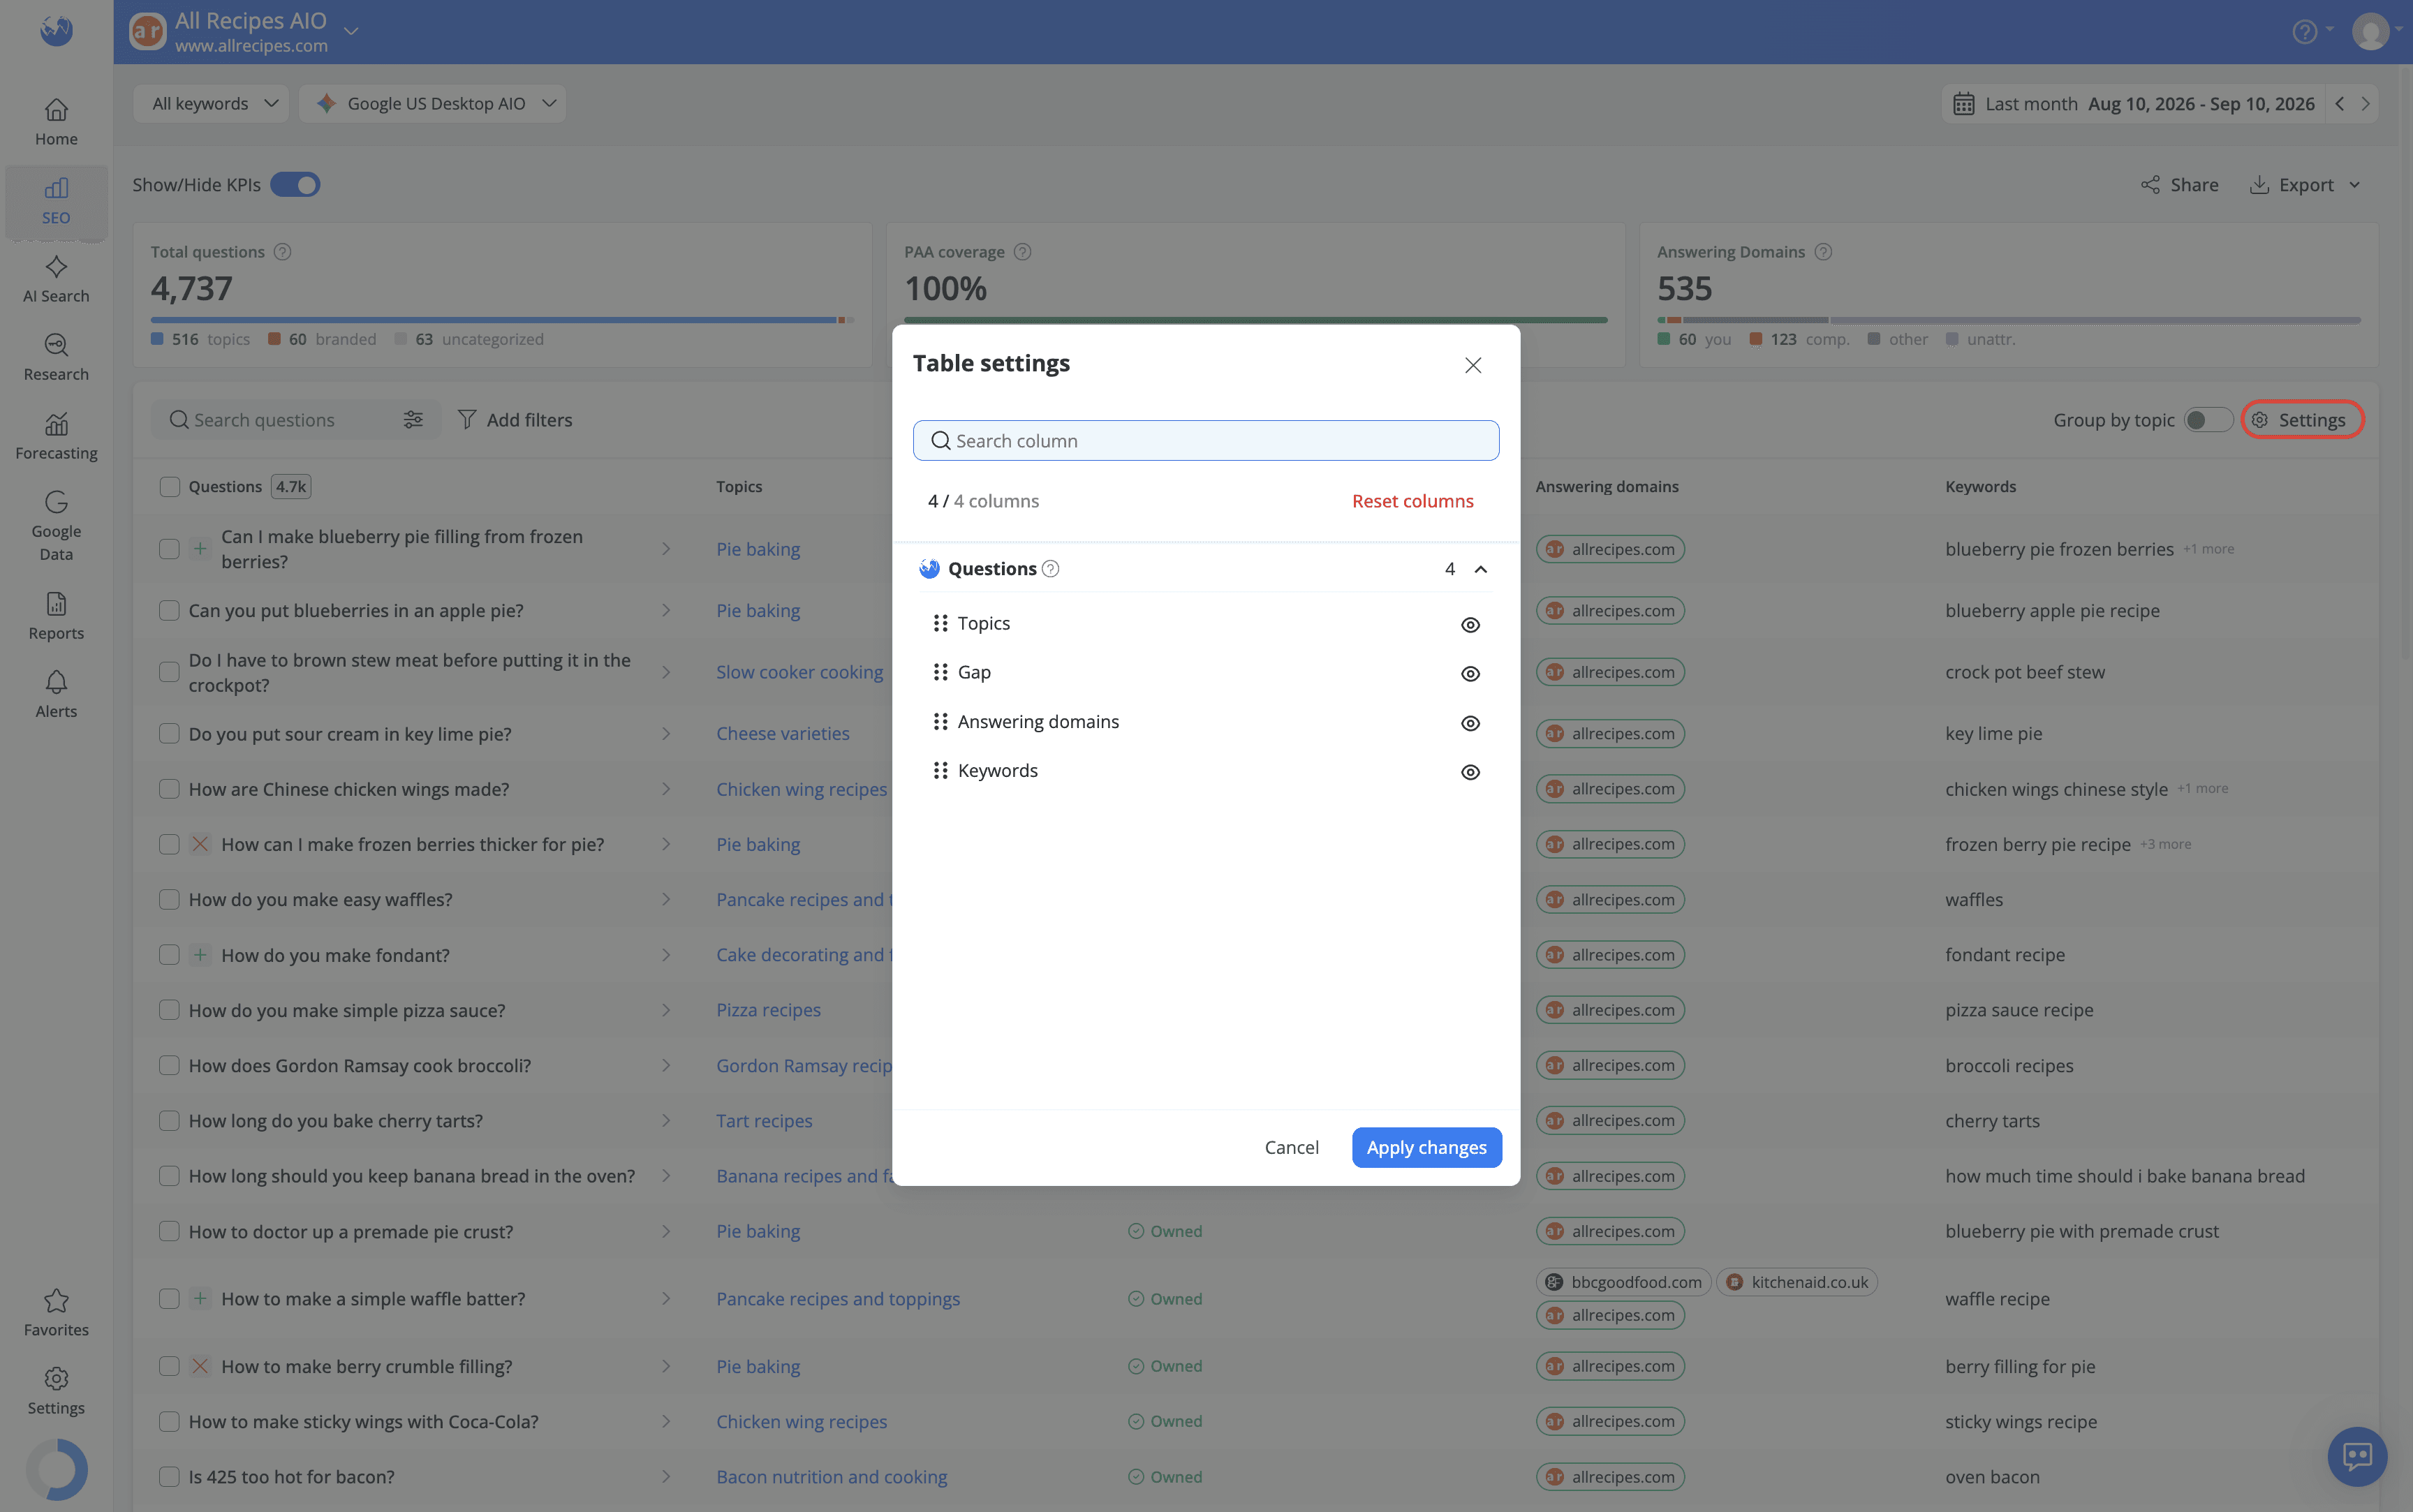
Topics are created using semantic clustering, which groups questions based on their underlying intent rather than their exact wording. For example, "Do you thaw frozen berries before making a pie?" and "Do you have to thaw frozen blueberries before baking a pie?" can be grouped under the same topic, Pie baking.
This makes it easier to plan content around broader topics instead of treating every question as a separate opportunity. A single, well-optimized page may be able to address several related questions within the same cluster, helping you focus your efforts where they can have the most impact.
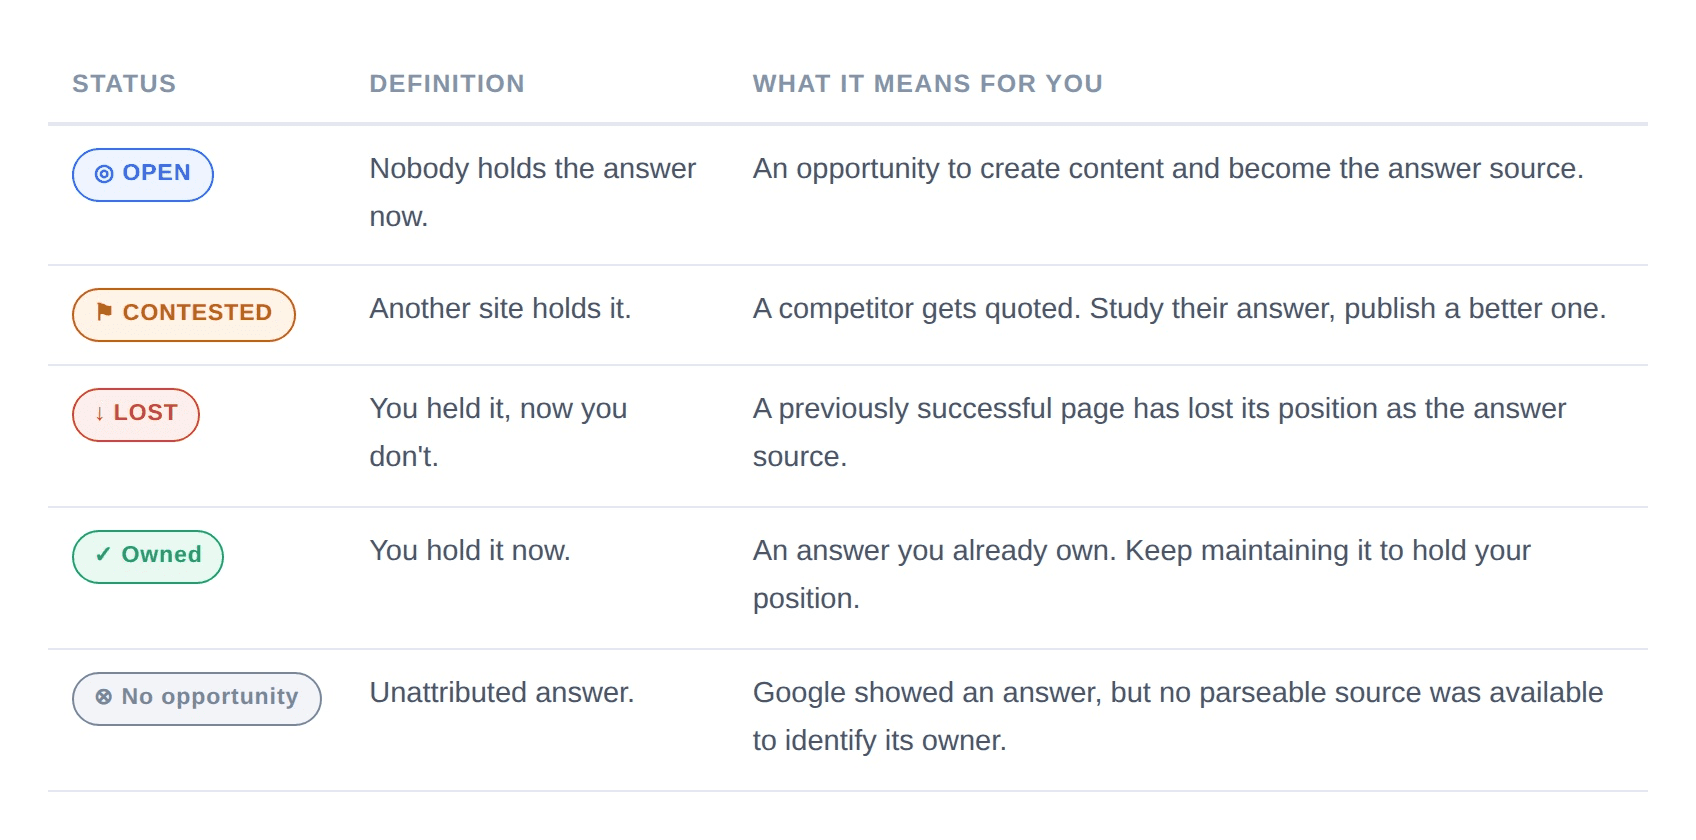
The Gap column - see who owns each answer

The Gap column summarizes the competitive picture of each question into one of five states, always relative to your domain:
You'll also see two markers in the Questions column that show when questions appear or disappear. A green + indicates that a question appeared in Google during the selected period, while a red × indicates that it is no longer shown.
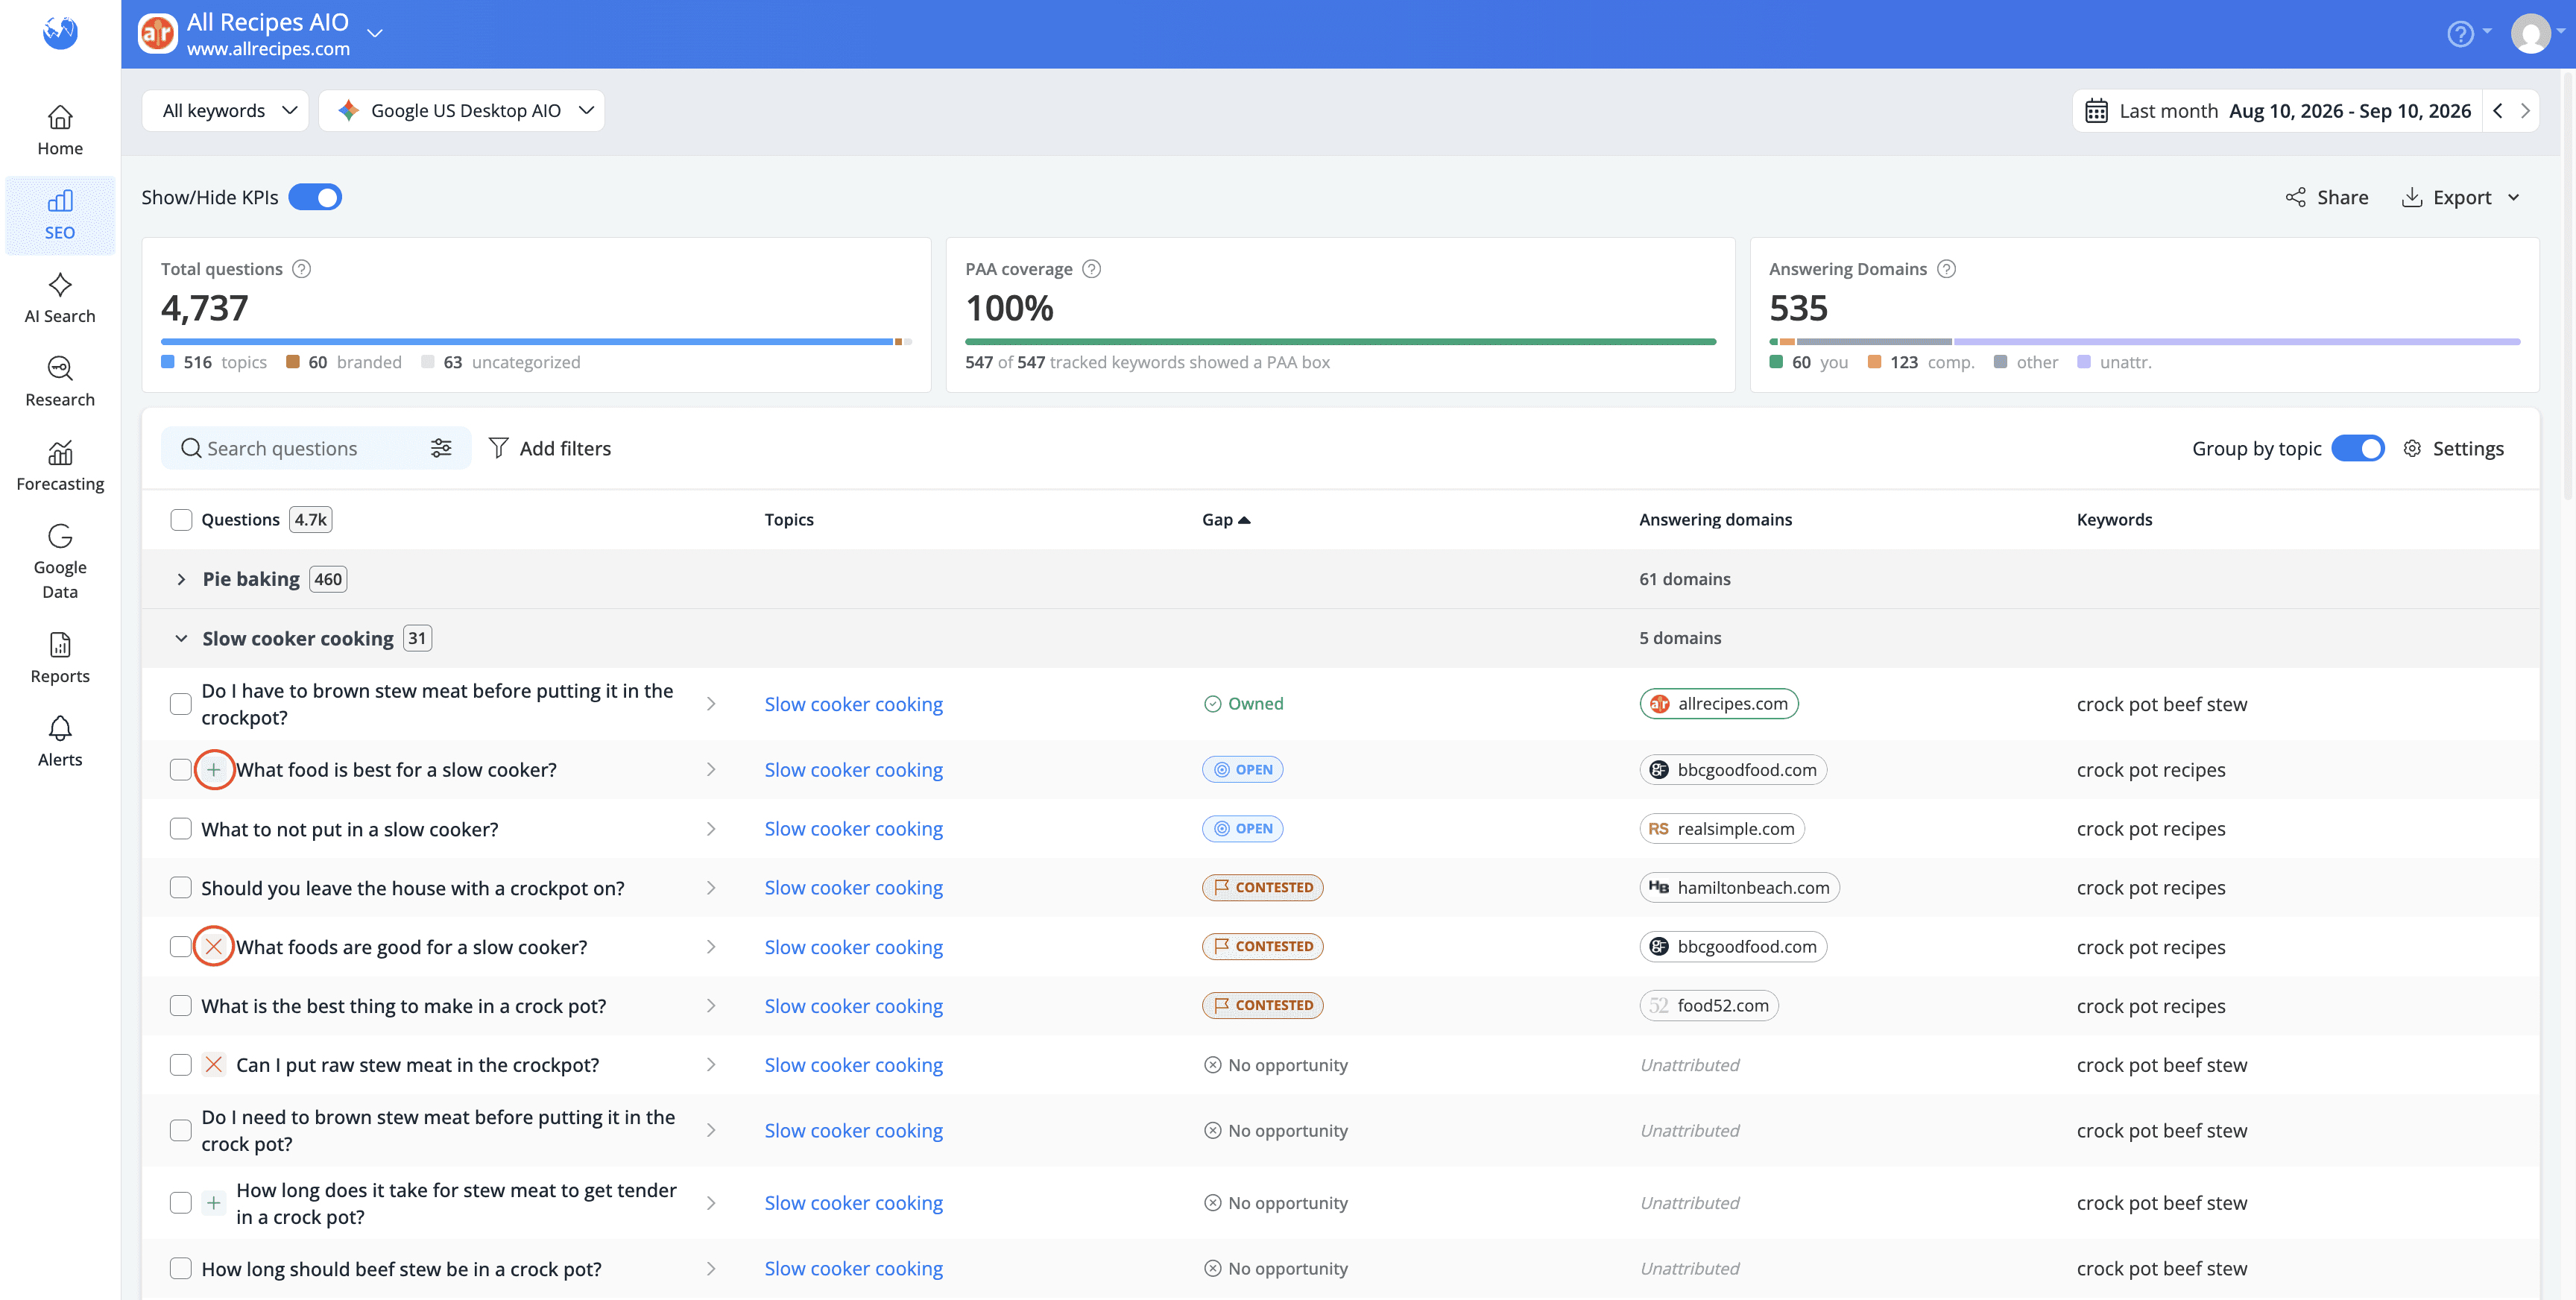
Because Google can change the questions shown in PAA, these markers, together with the Question changes filter for Appeared and Dropped, make it easier to spot questions that are emerging or disappearing between dates.
See what is behind each question
Click any row to open the question drawer, which brings together everything AWR knows about that question: its topic, the domains currently answering it and the tracked keywords that triggered it.
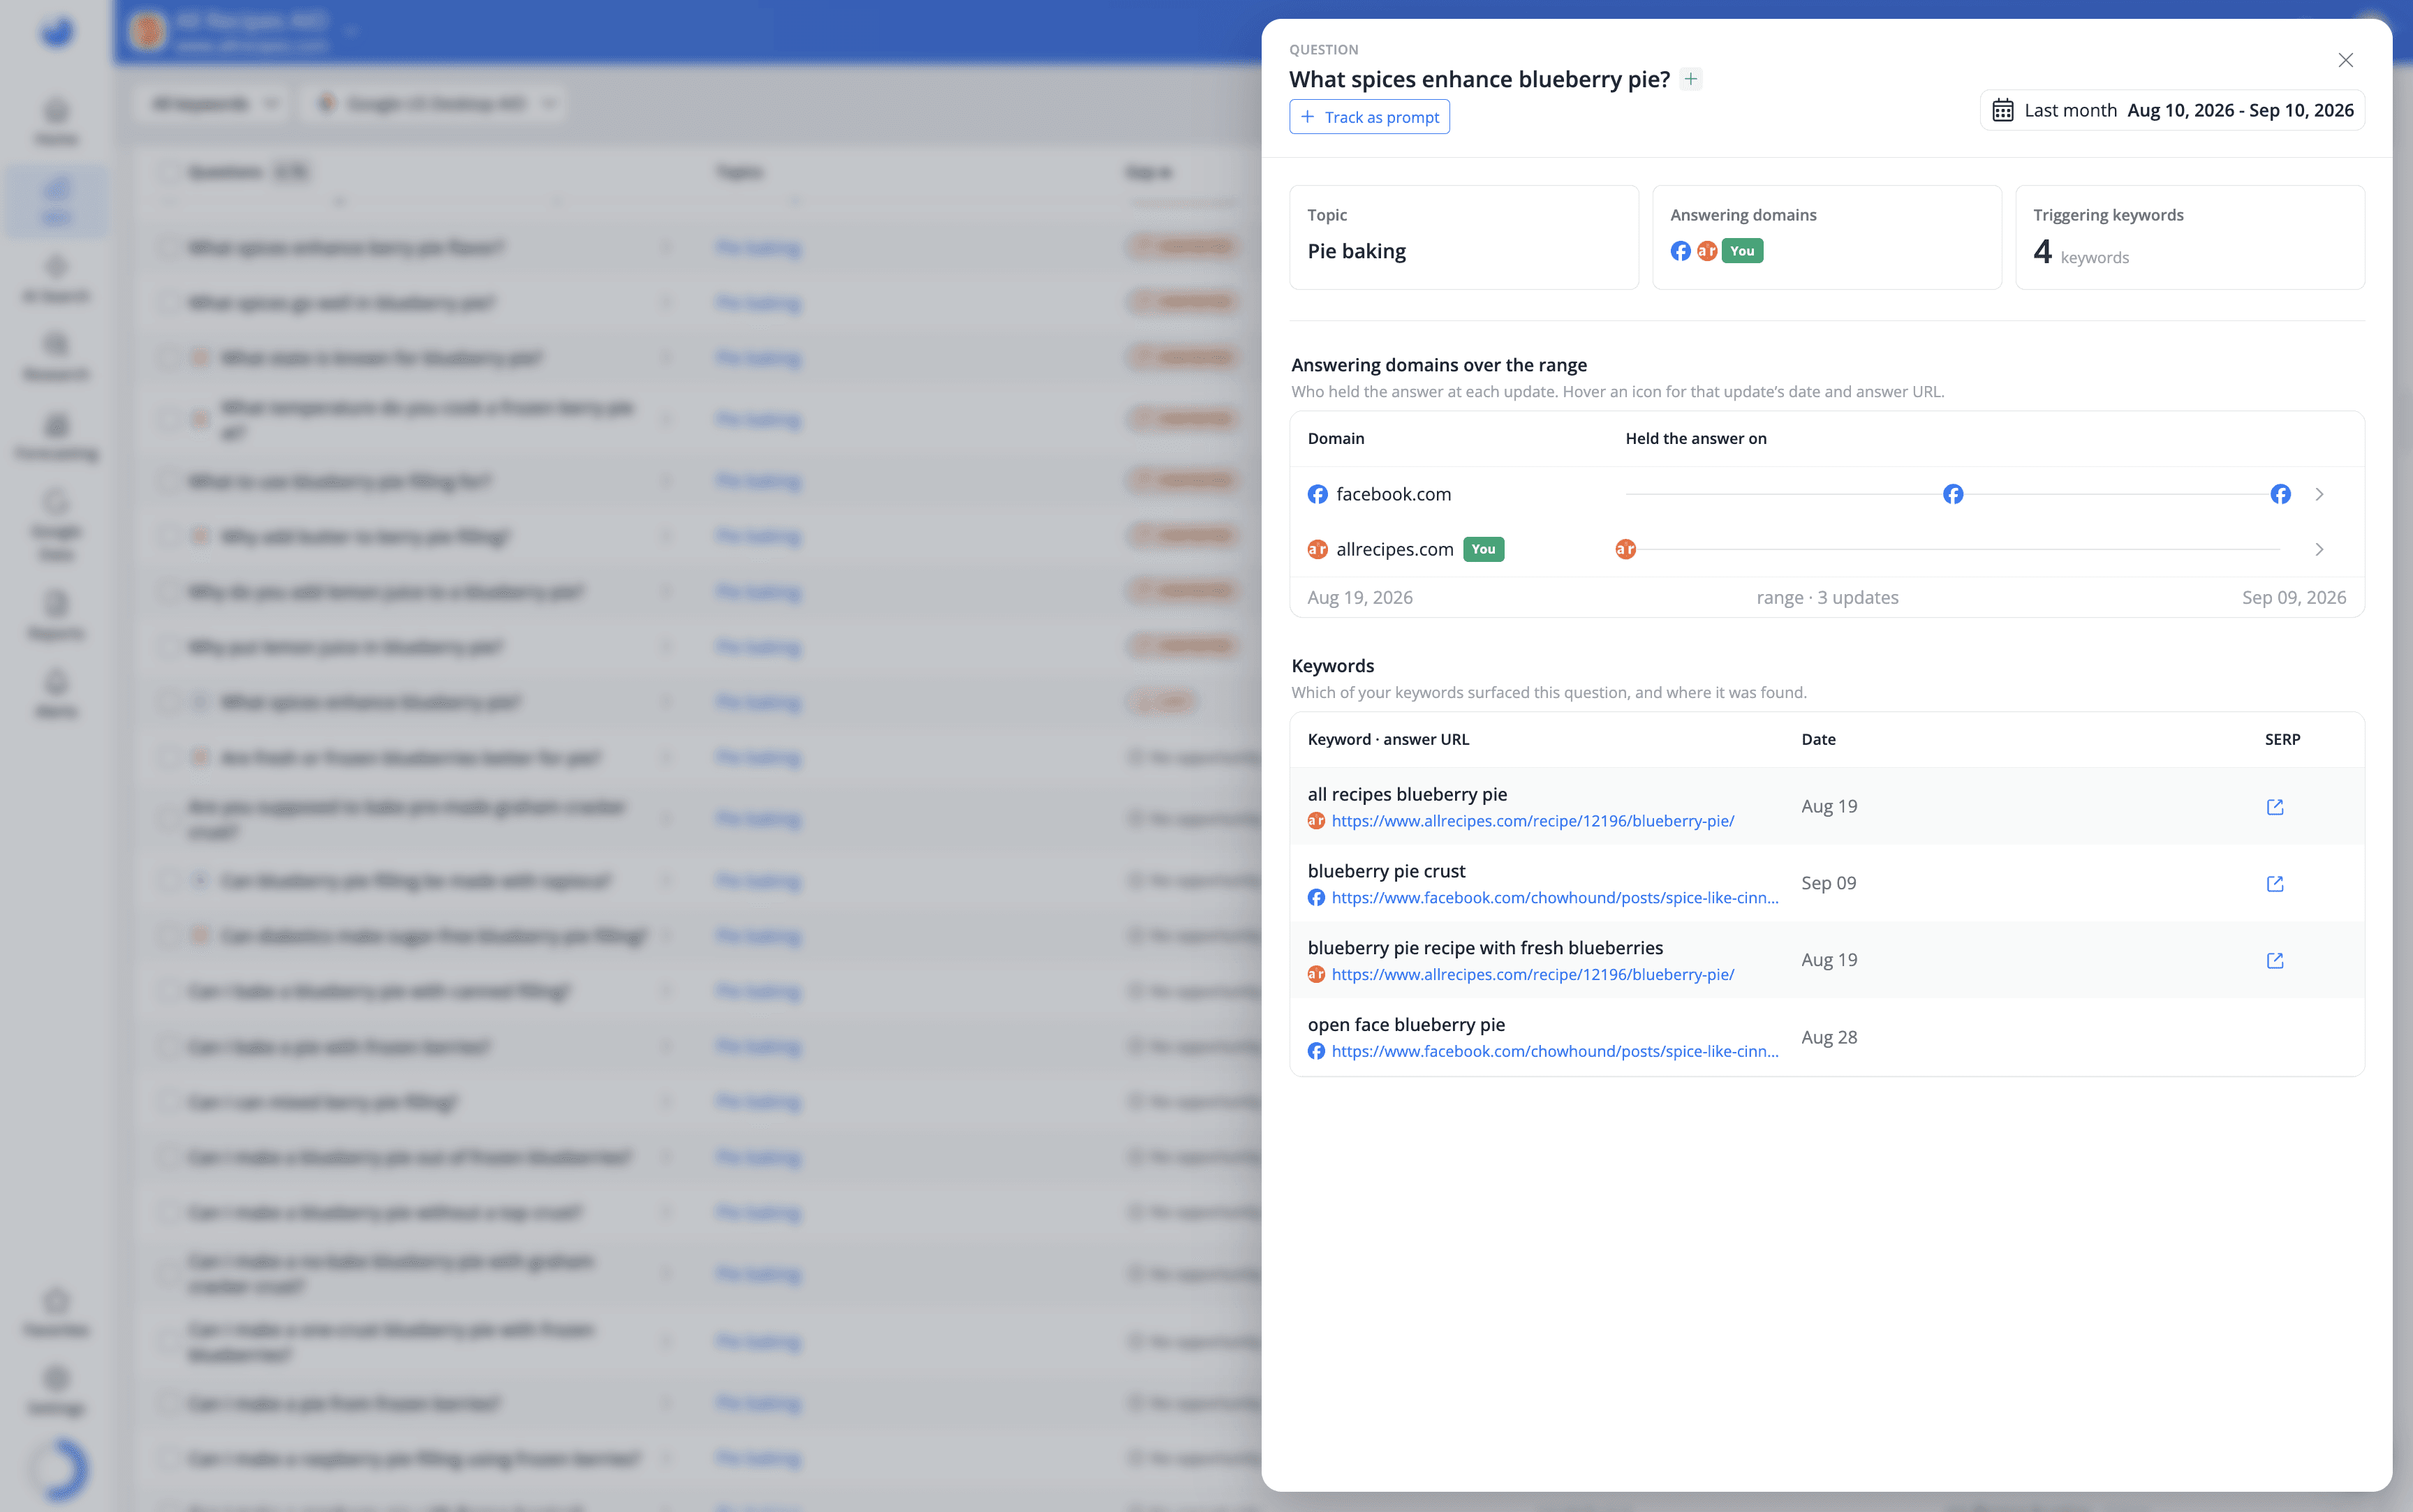
The timeline helps you understand how answer ownership changed over the selected date range. For example, a Contested question may have changed hands during the period, while a Lost question shows that your site previously held the answer but no longer does. The answer URL gives you the exact page Google used for each keyword occurrence, making it easier to investigate why a page is winning or identify what you need to improve.
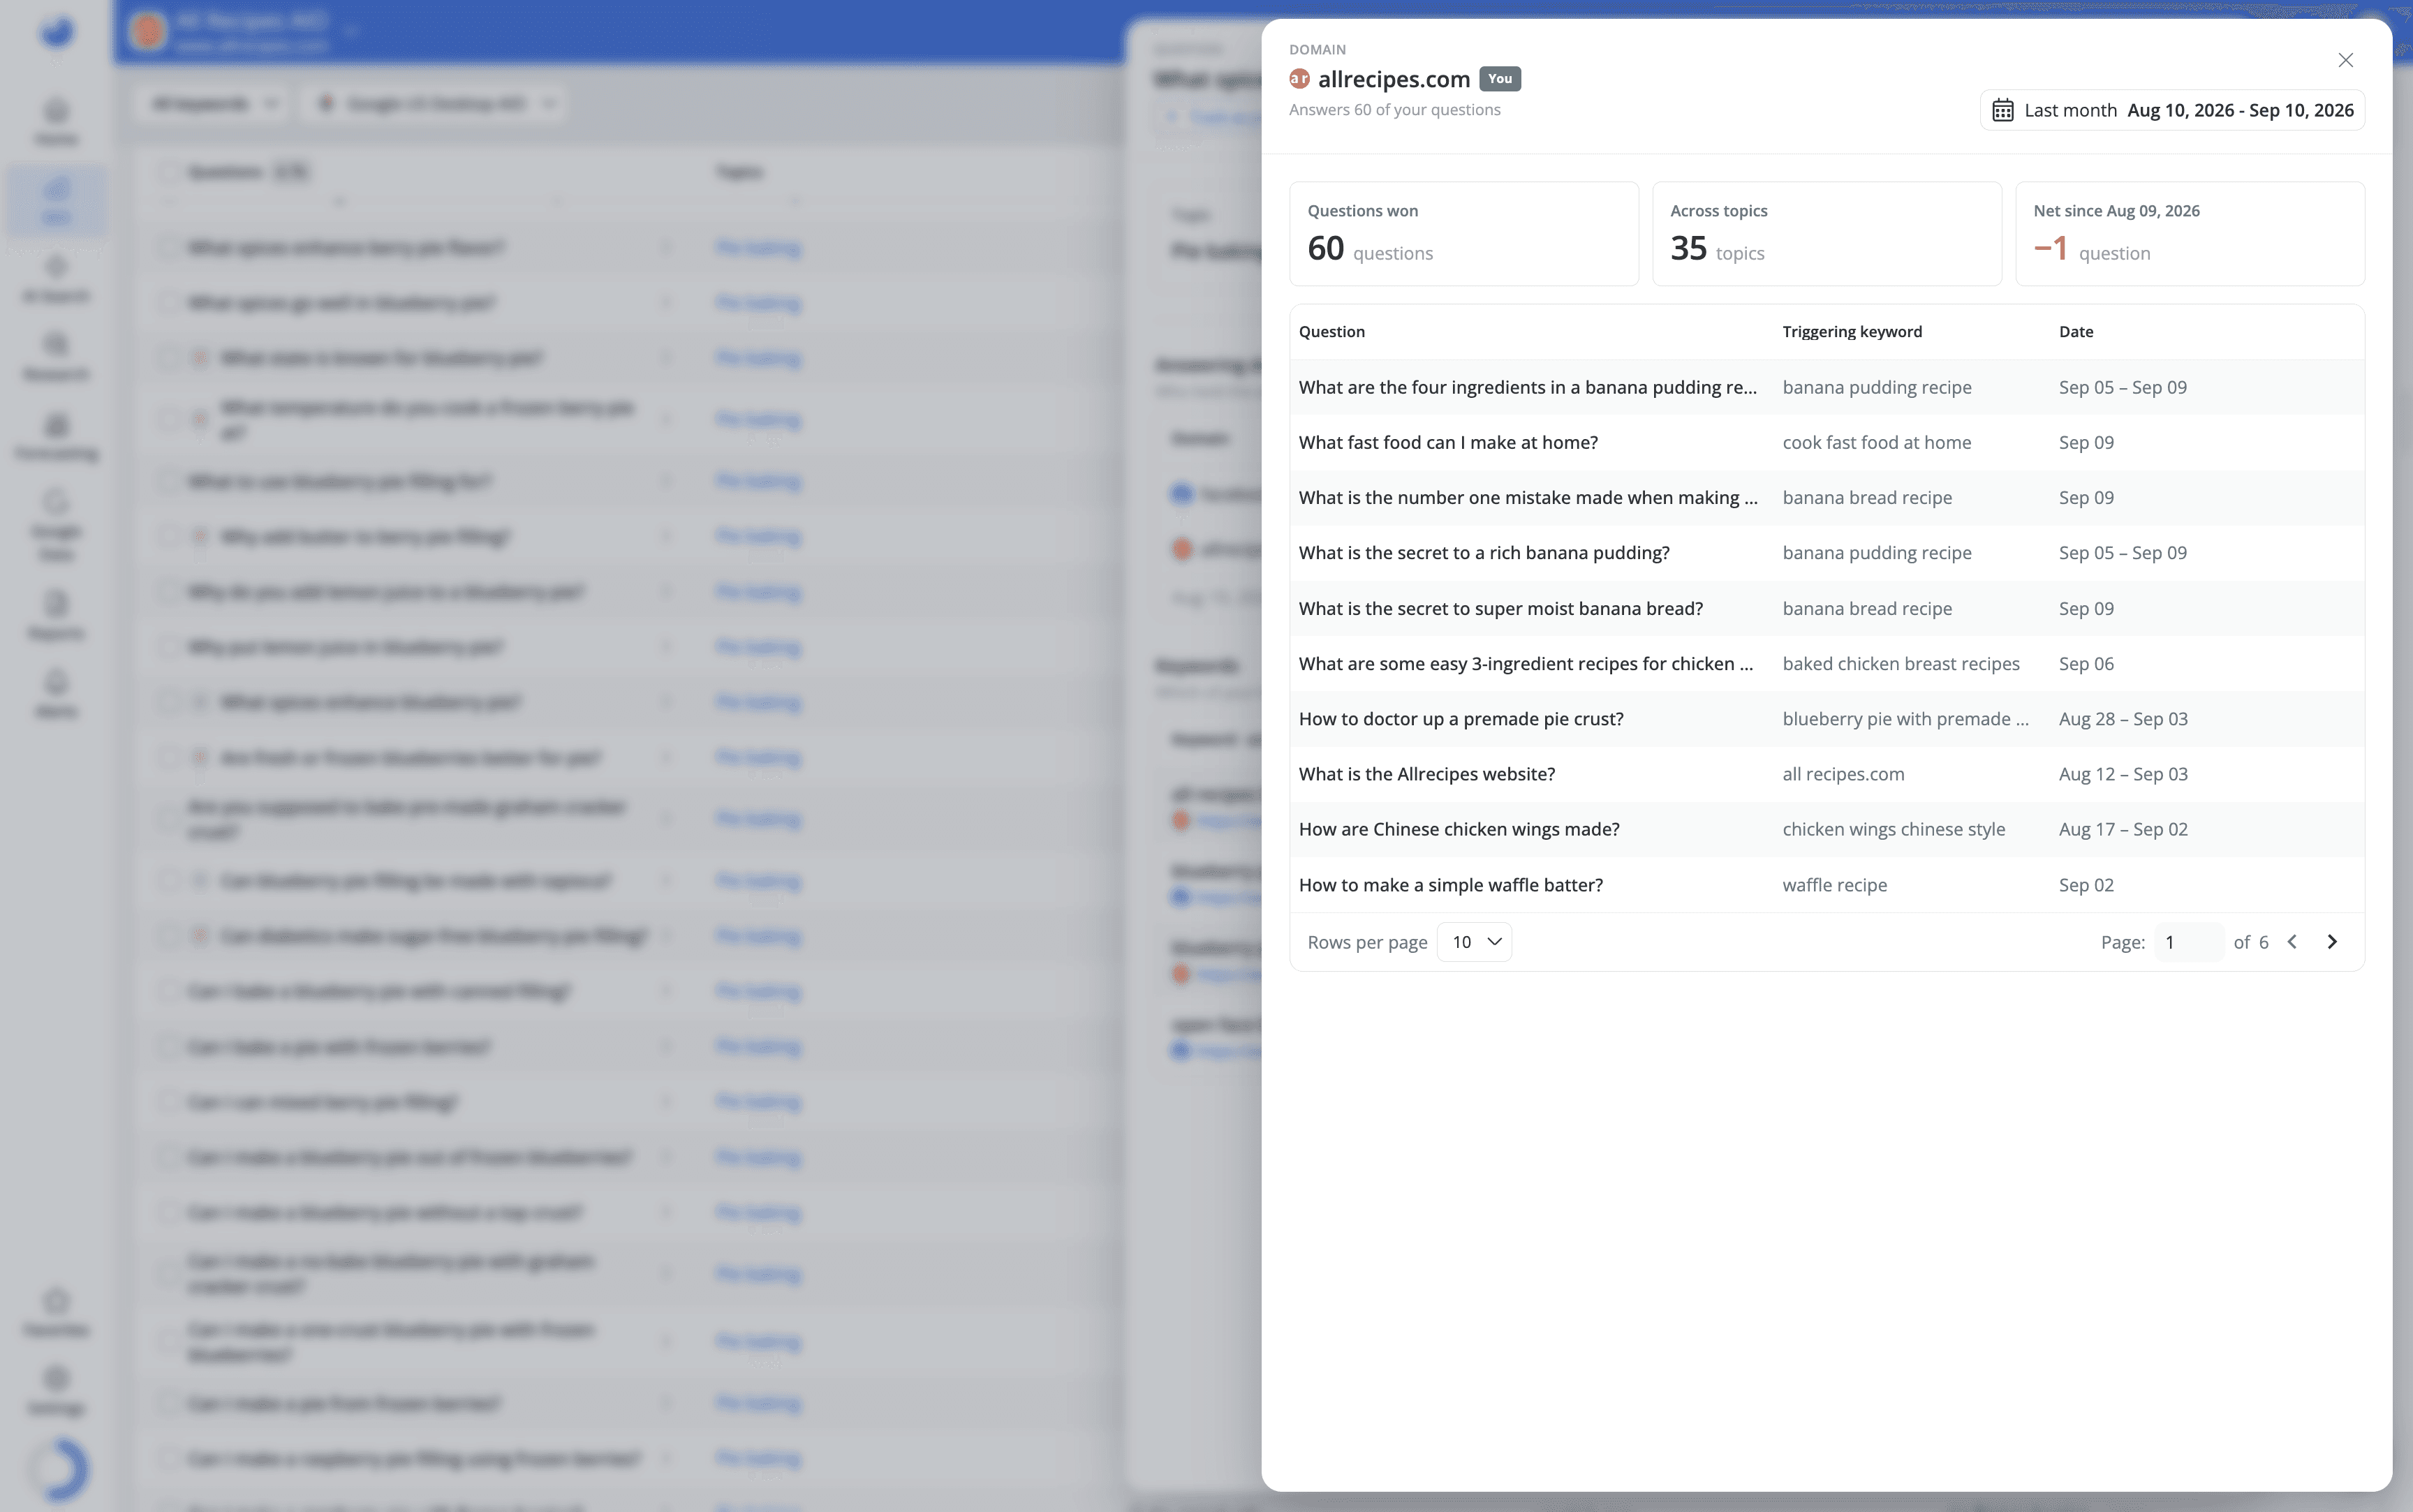
From the timeline, you can click an answering domain to open the domain drawer. This gives you a closer look at that answer source, including how many of your tracked questions it answers, how many topics those questions cover and how its number of answers has changed since the start of the selected date range.
And when you need proof rather than a summary, the View SERP button in the keywords table
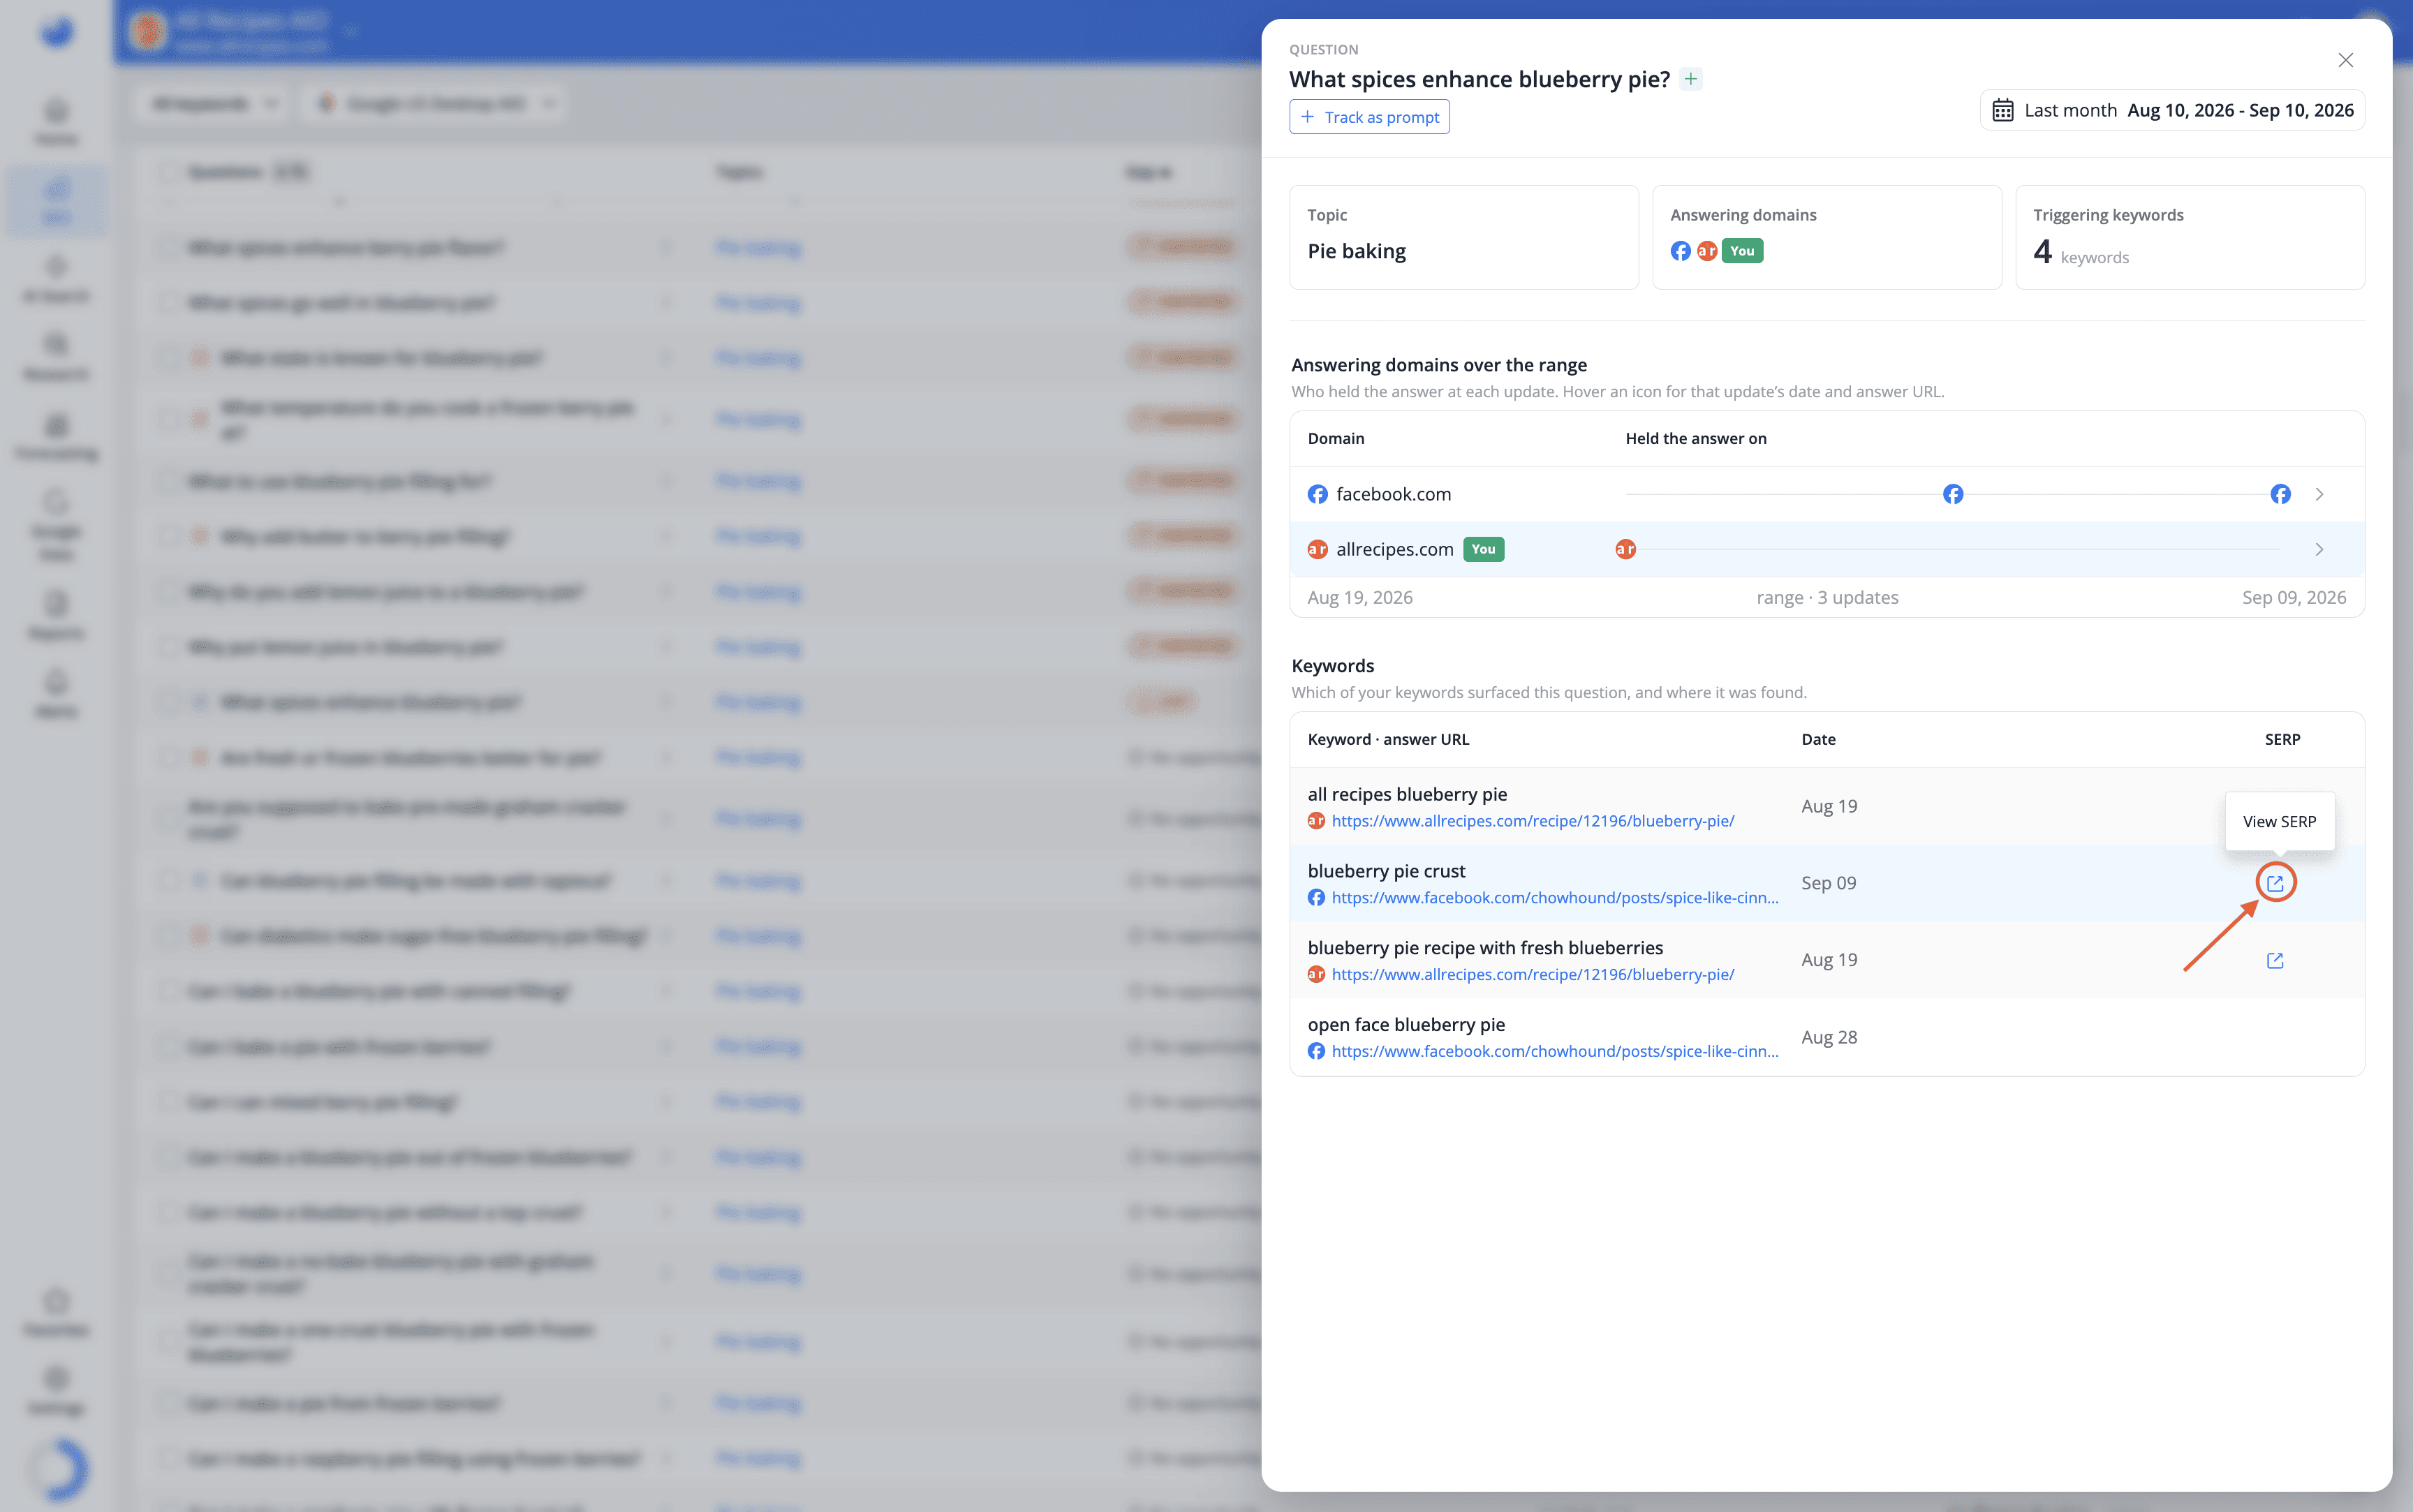
opens AWR's snapshot of the actual results page, with the PAA box labeled at its exact position among the other results.

Find the questions you need
The search box gives you several ways to find specific questions.
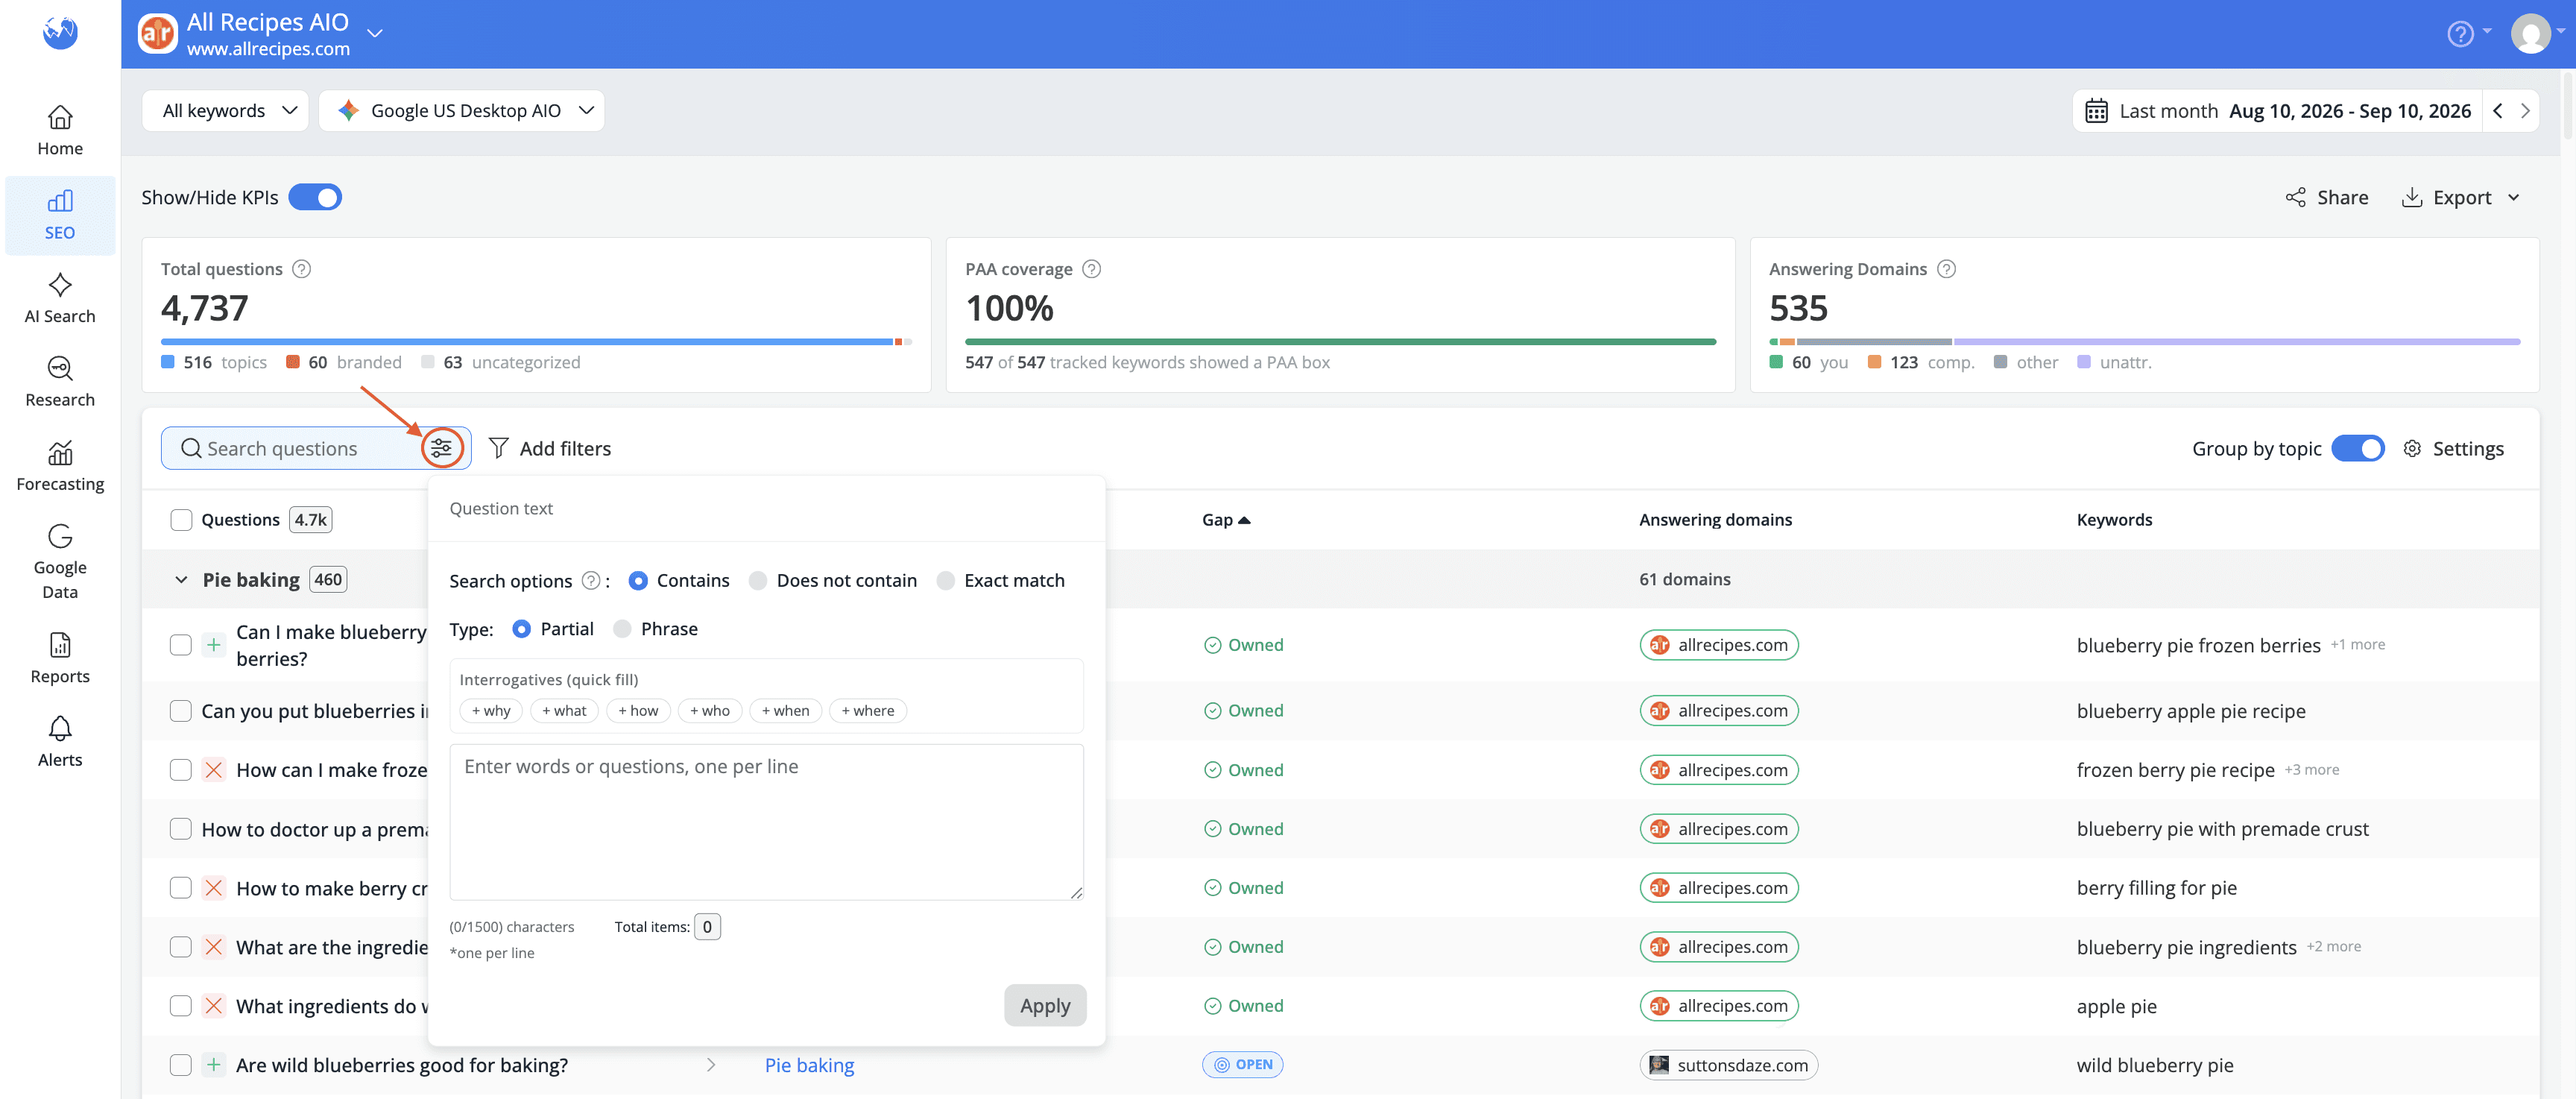
You can search for terms that contain, do not contain, or exactly match what you input and choose between partial and phrase matching.
The interrogative quick-fill chips let you filter questions by type with one click, including +why, +what, +how, +who, +when, and +where. For example, why questions can help you find topics that need an explanation, while how questions can point to opportunities for tutorial content.
You can also paste a list of up to 1,500 characters, with one term or question per line, to check multiple questions at once.
You can combine your search with filters for Topic, Gap, Answering domains, Branded question and Question changes.
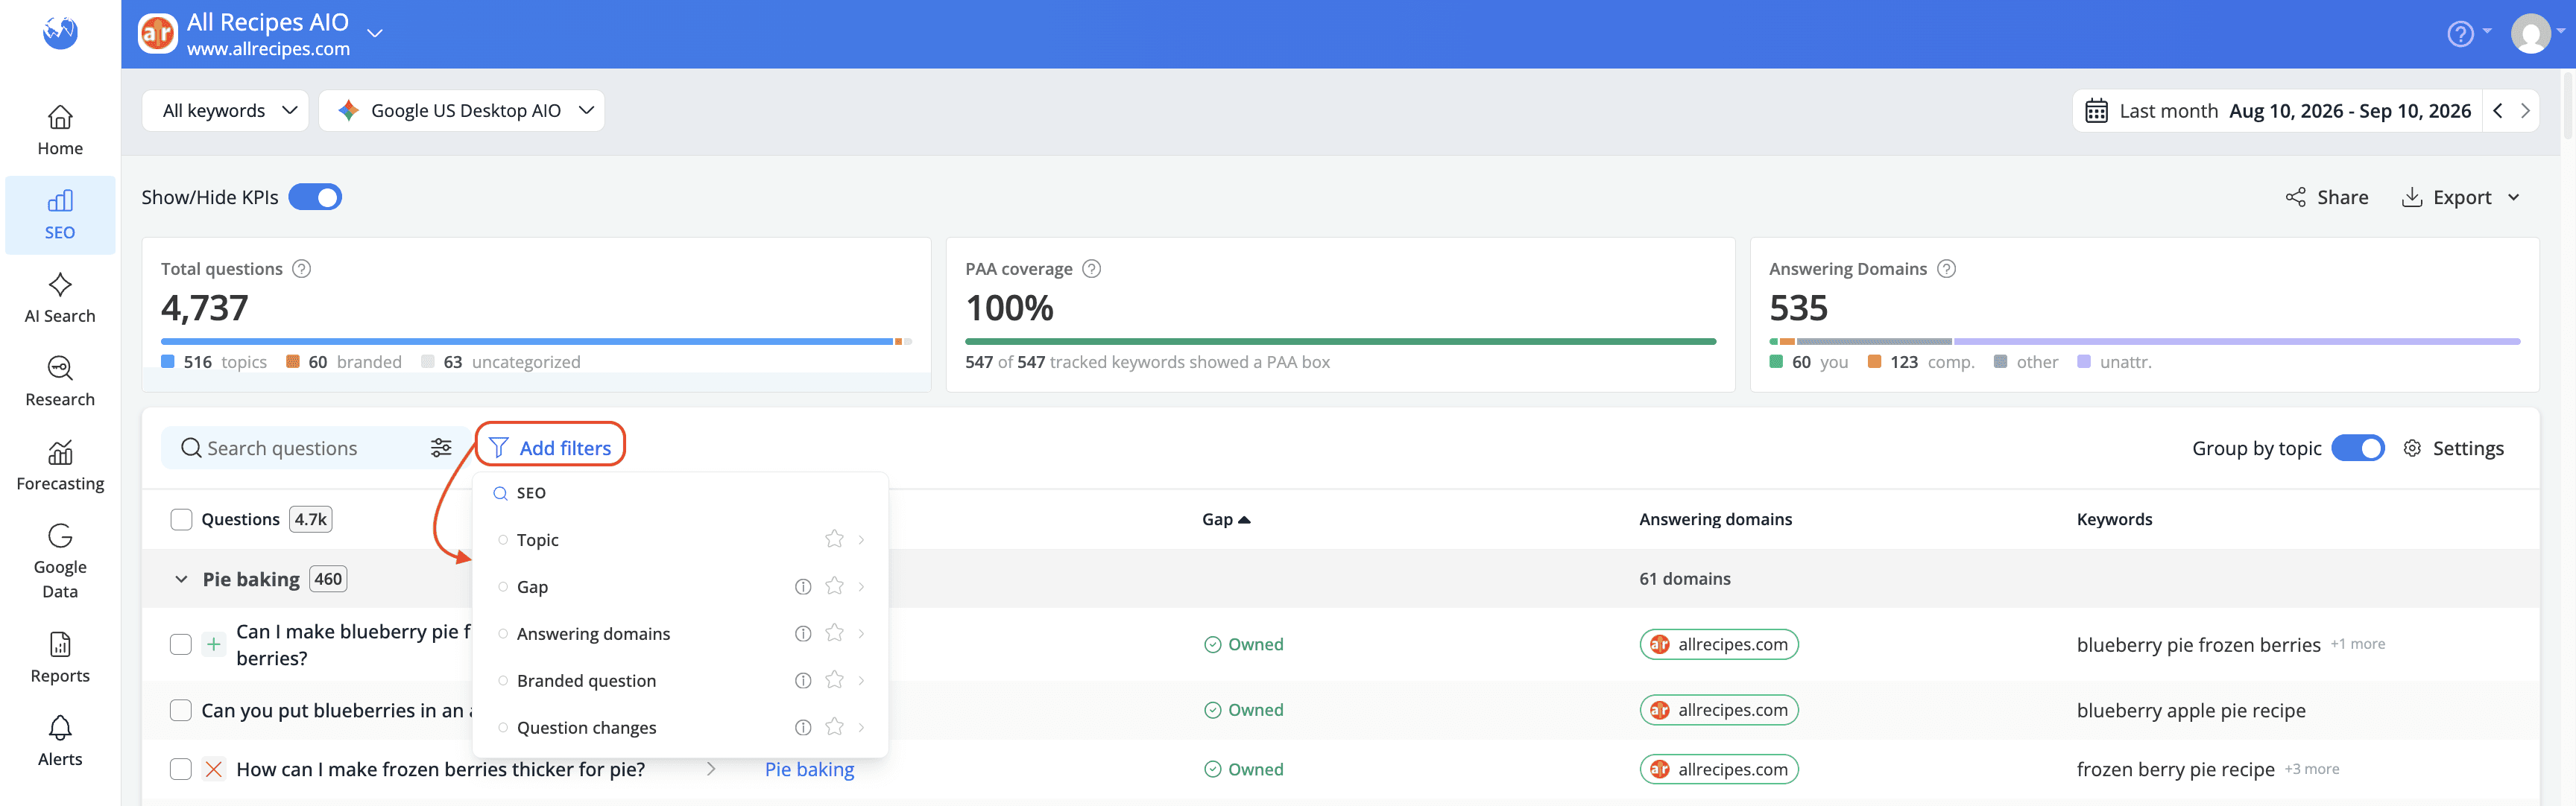
The Branded question filter separates branded and non-branded questions, while Question changes lets you find questions that Appeared or Dropped during the selected date range.
All charts, KPI cards and counts update based on the filters you apply. This lets you quickly narrow the report to a specific set of questions, such as non-branded, contested, how questions within a particular topic. You can also click a topic name directly in the table to apply that topic as a filter.
When you are ready to use the data elsewhere, the Export feature lets you download the current view as CSV or XLSX or send it directly to Google Sheets.

Share generates a live link that you can use to share the current report view with people outside your AWR account.
Five ways to use the Questions report in your SEO workflow
1.Build a question-led content plan
Open Questions by topic, sort the clusters by size and filter to OPEN.
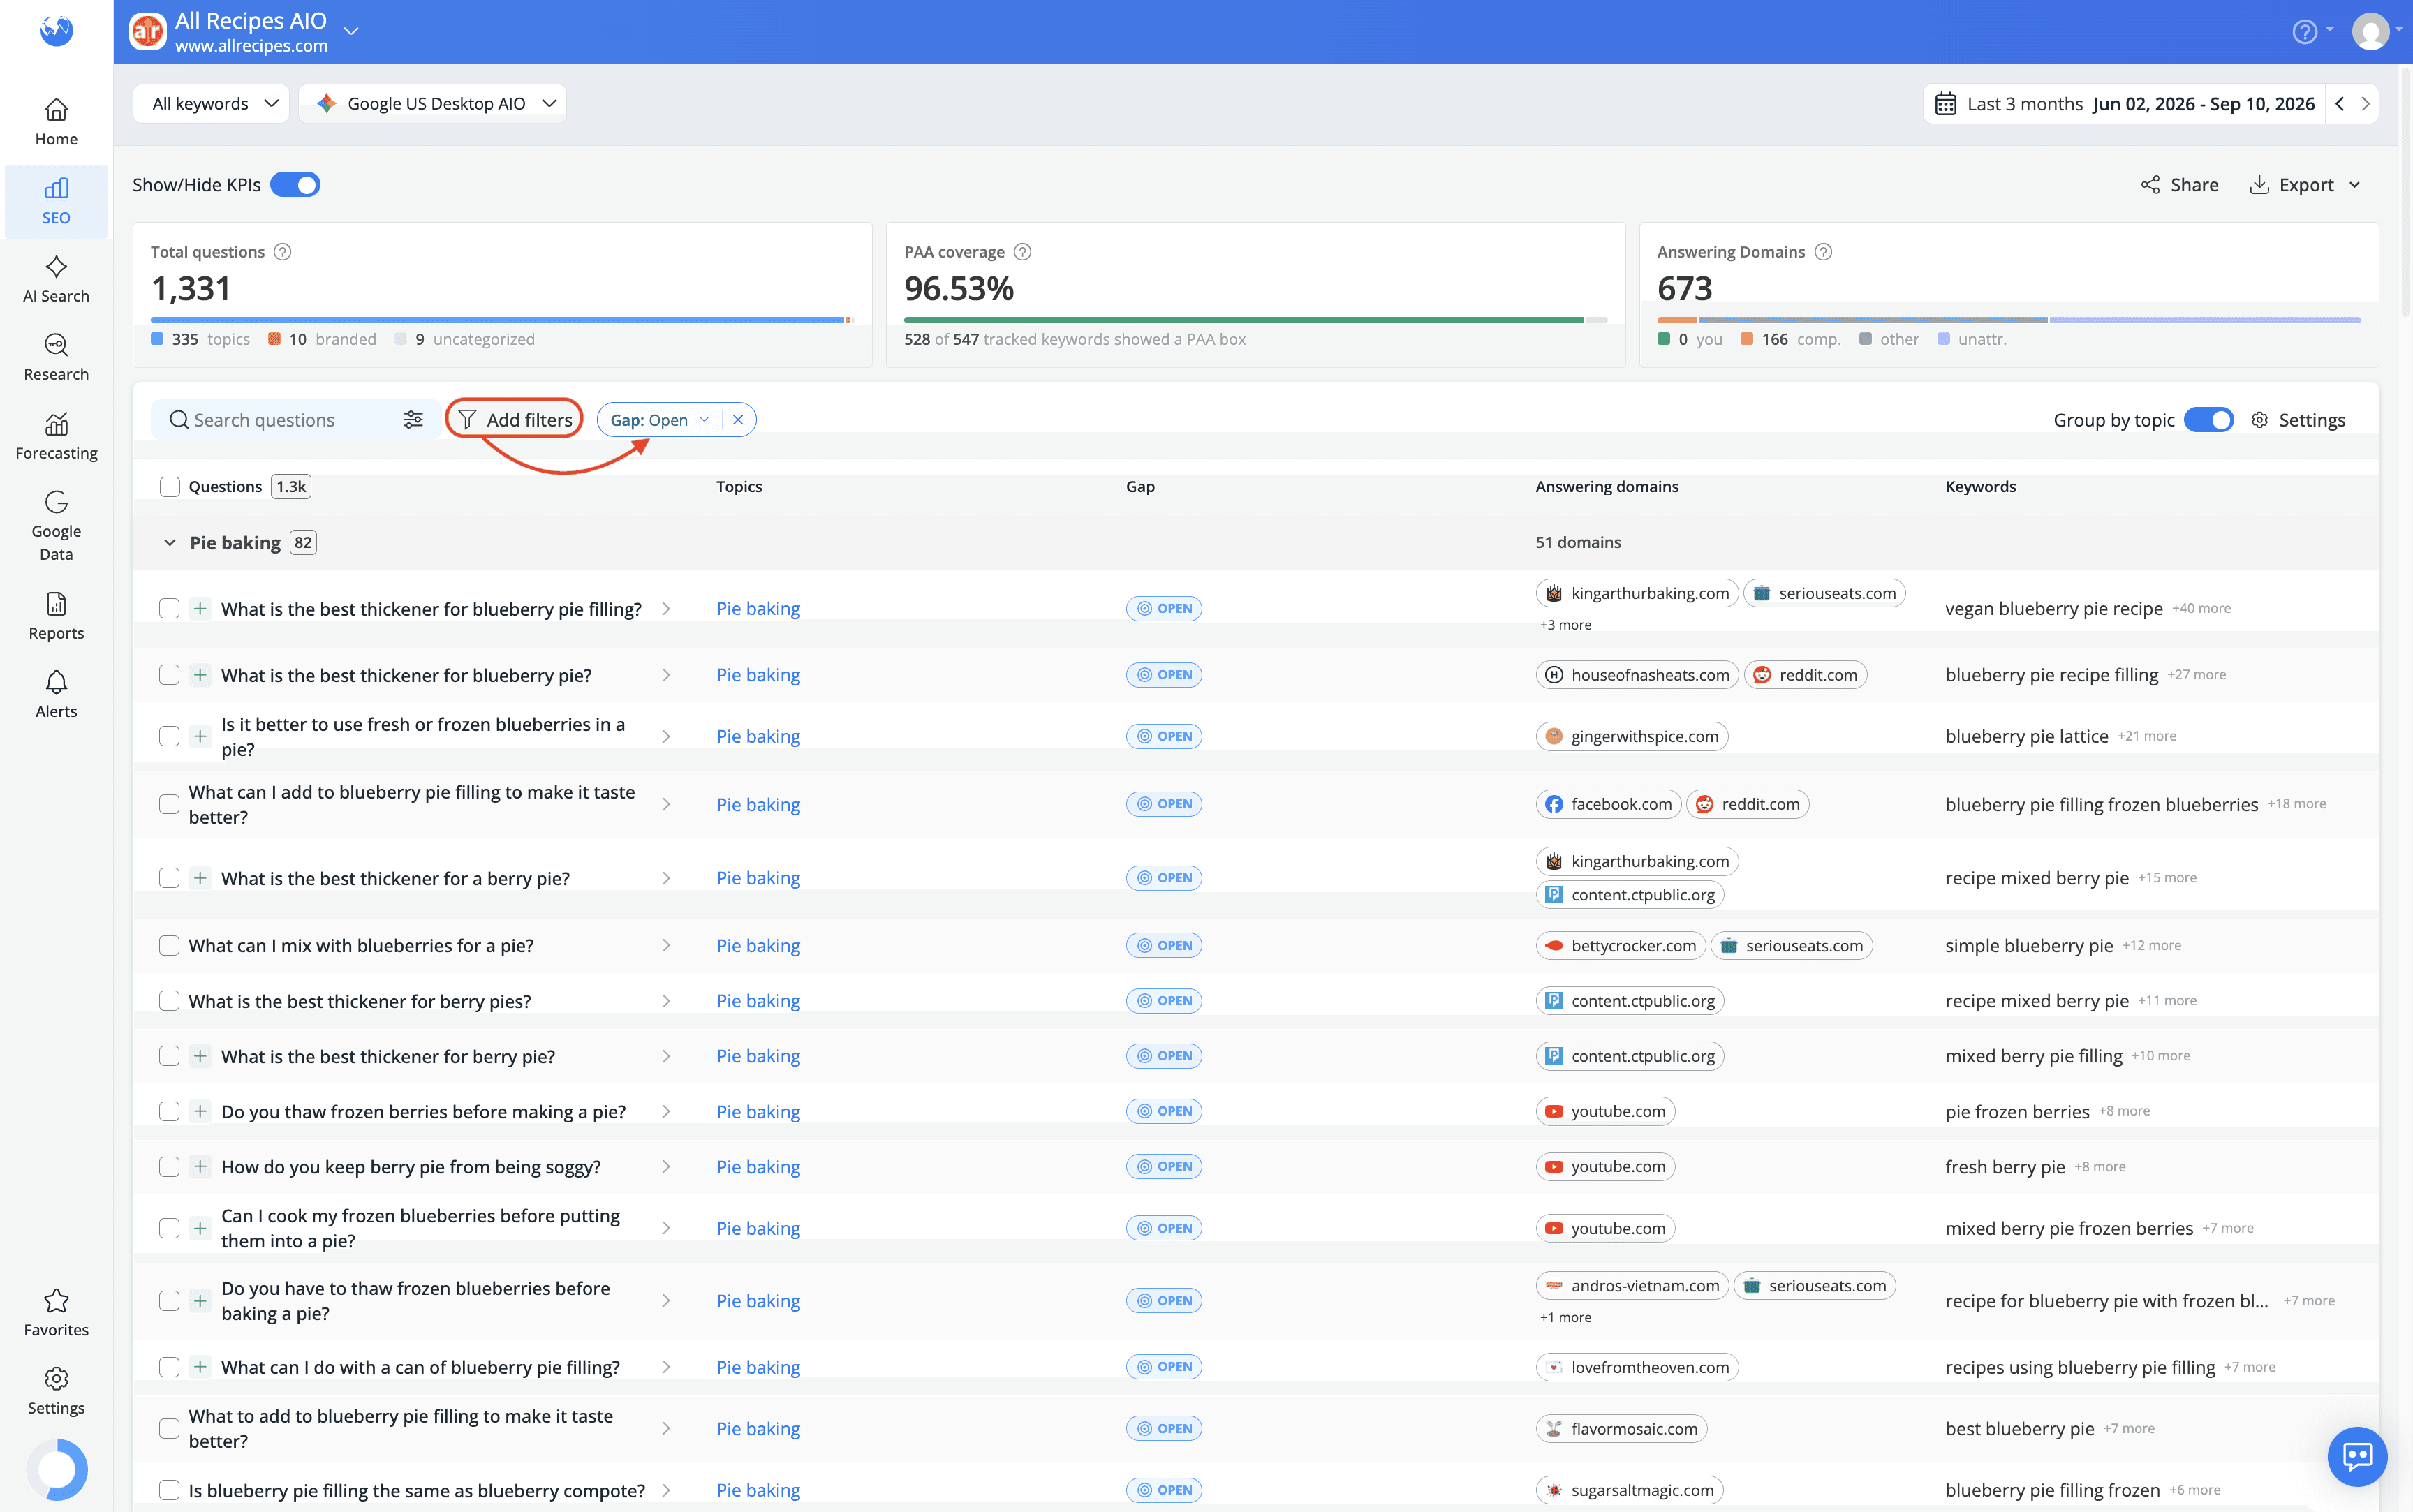
Large topics with many open questions can become content briefs. Create one comprehensive page for each topic, using the questions as H2 or H3 headings and providing concise answers under each one.
2.Improve contested answers
Filter to CONTESTED, open the question drawer and compare the answering URL with your own page.
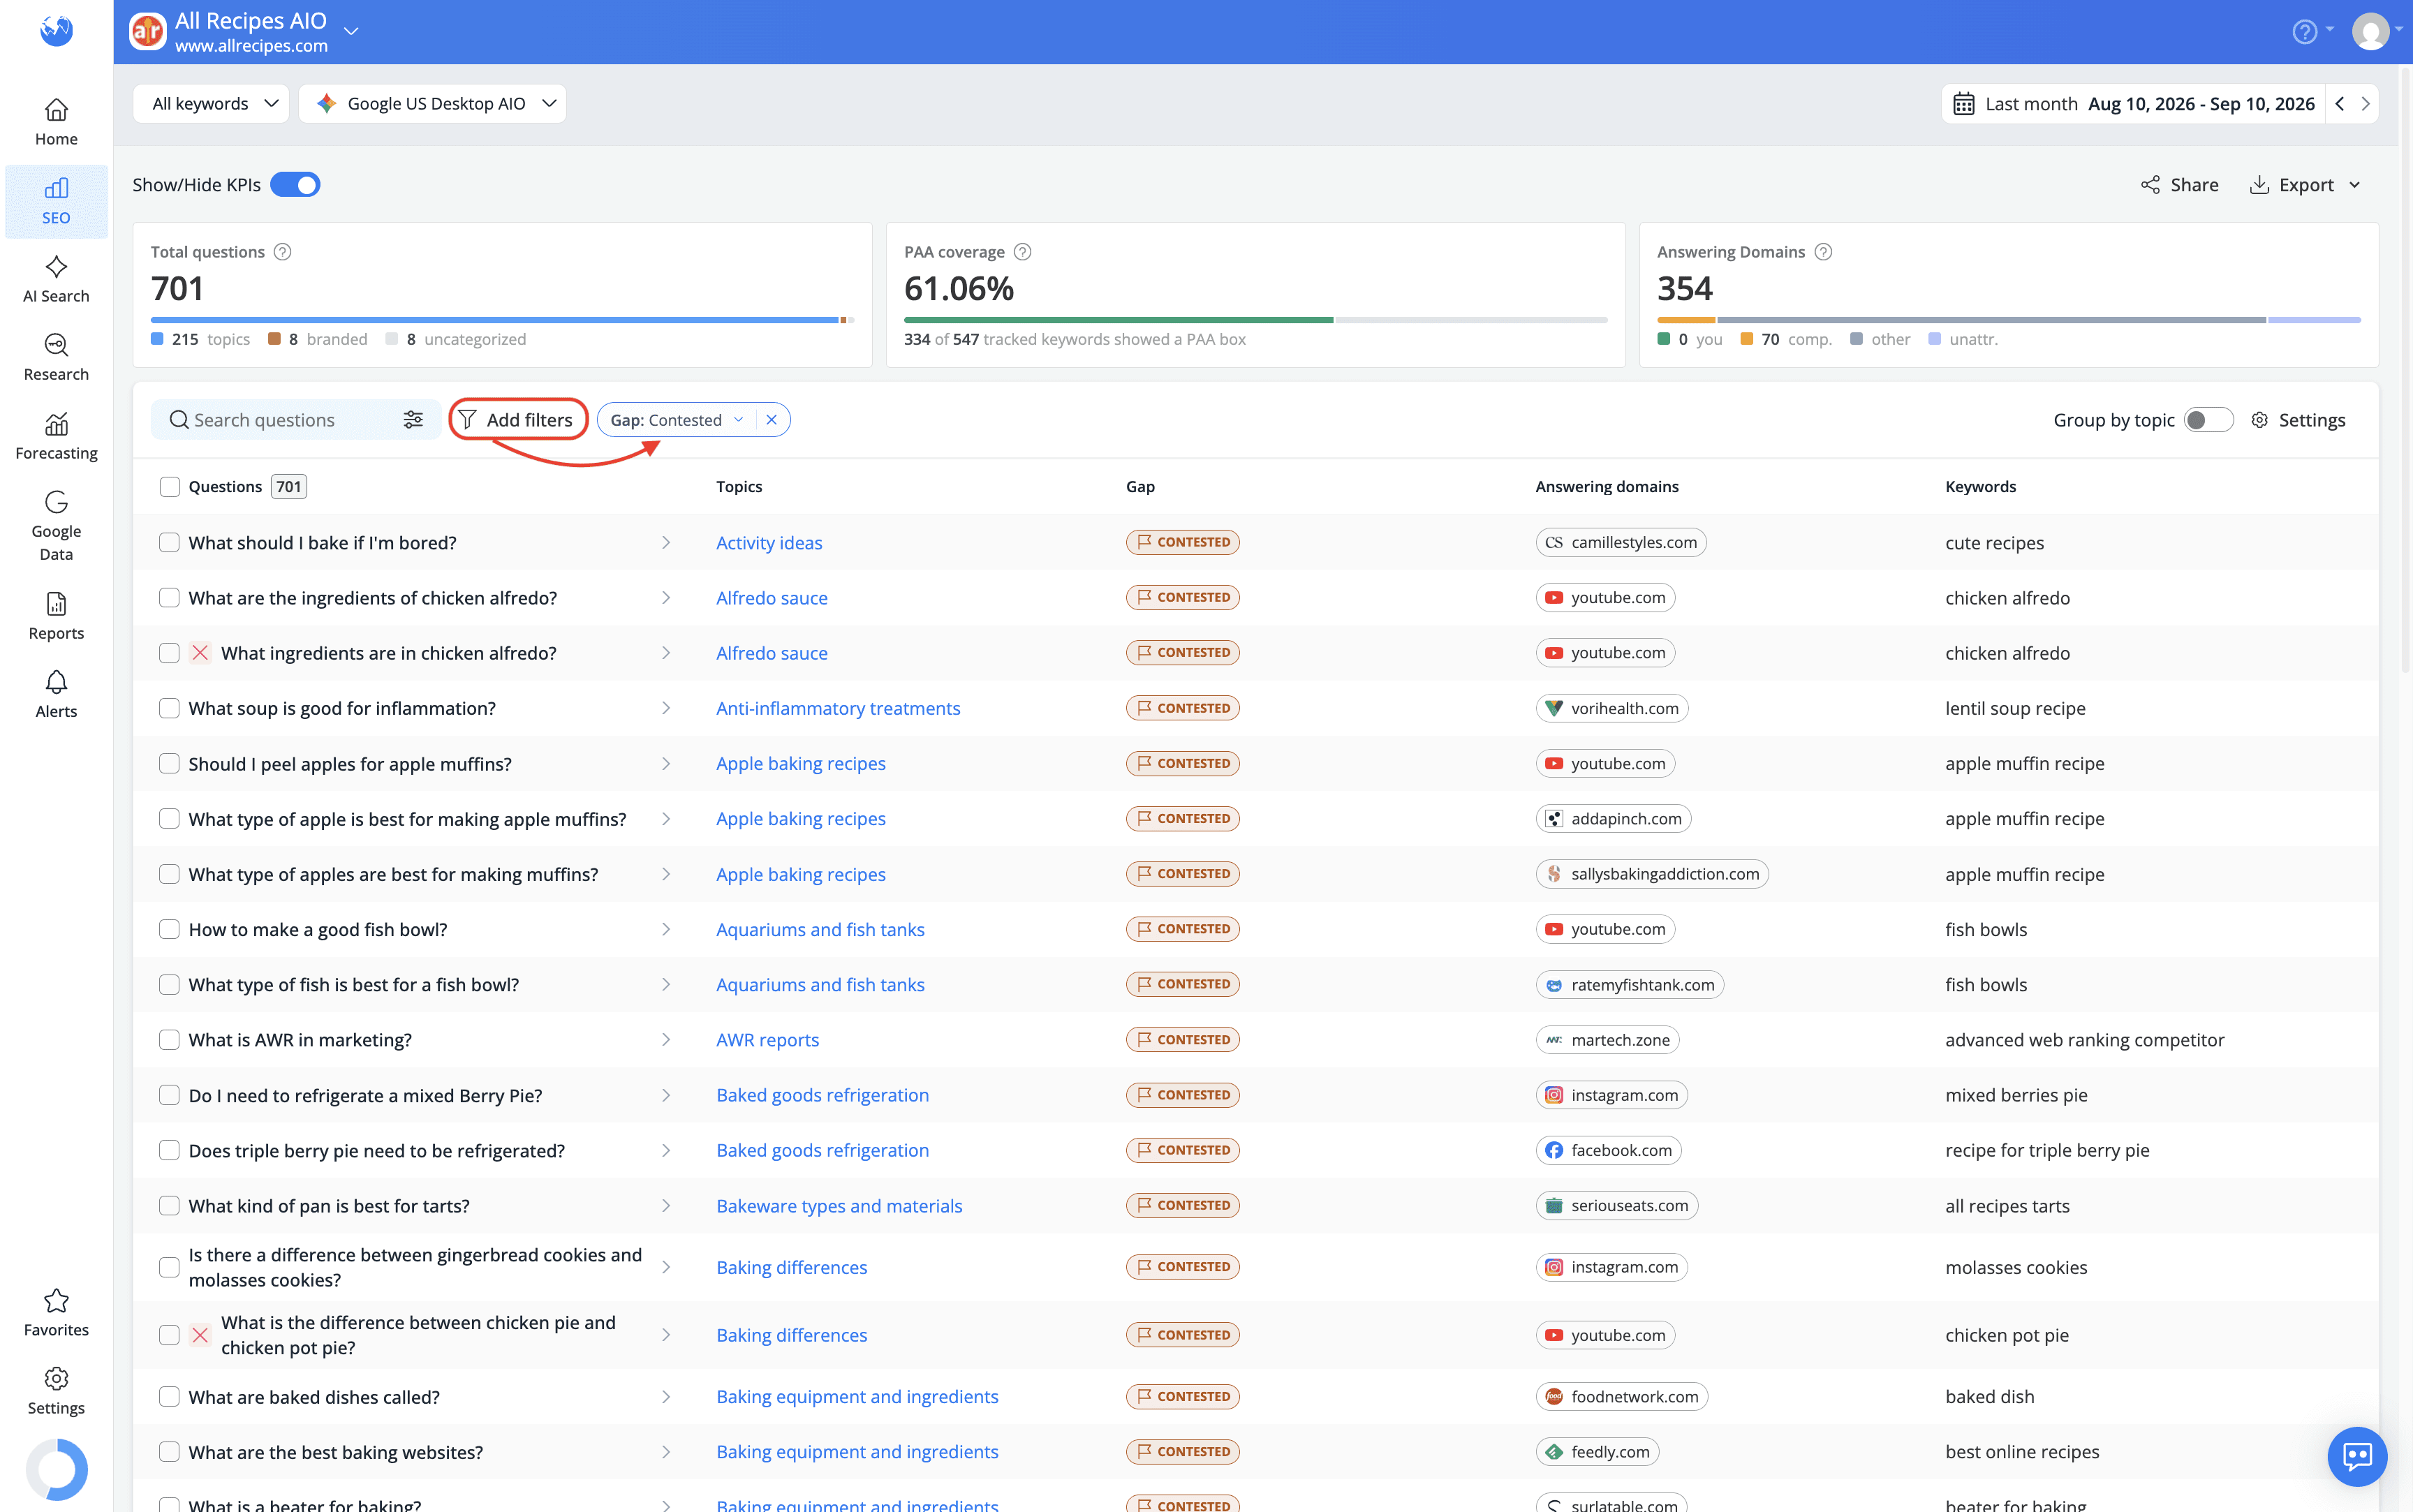
The ownership timeline shows how the answer changed over the selected date range, helping you understand whether a competitor has consistently held the answer or recently replaced a page.

3.Catch lost answers early
Use the LOST filter and compare dates to make a quick weekly check of the answers your site no longer owns.

This helps you identify which pages have lost PAA visibility and may need to be reviewed or refreshed.
4.Find your real PAA competitors
The Share of answers chart can reveal websites that frequently answer your questions but are not part of your competitor tracking.
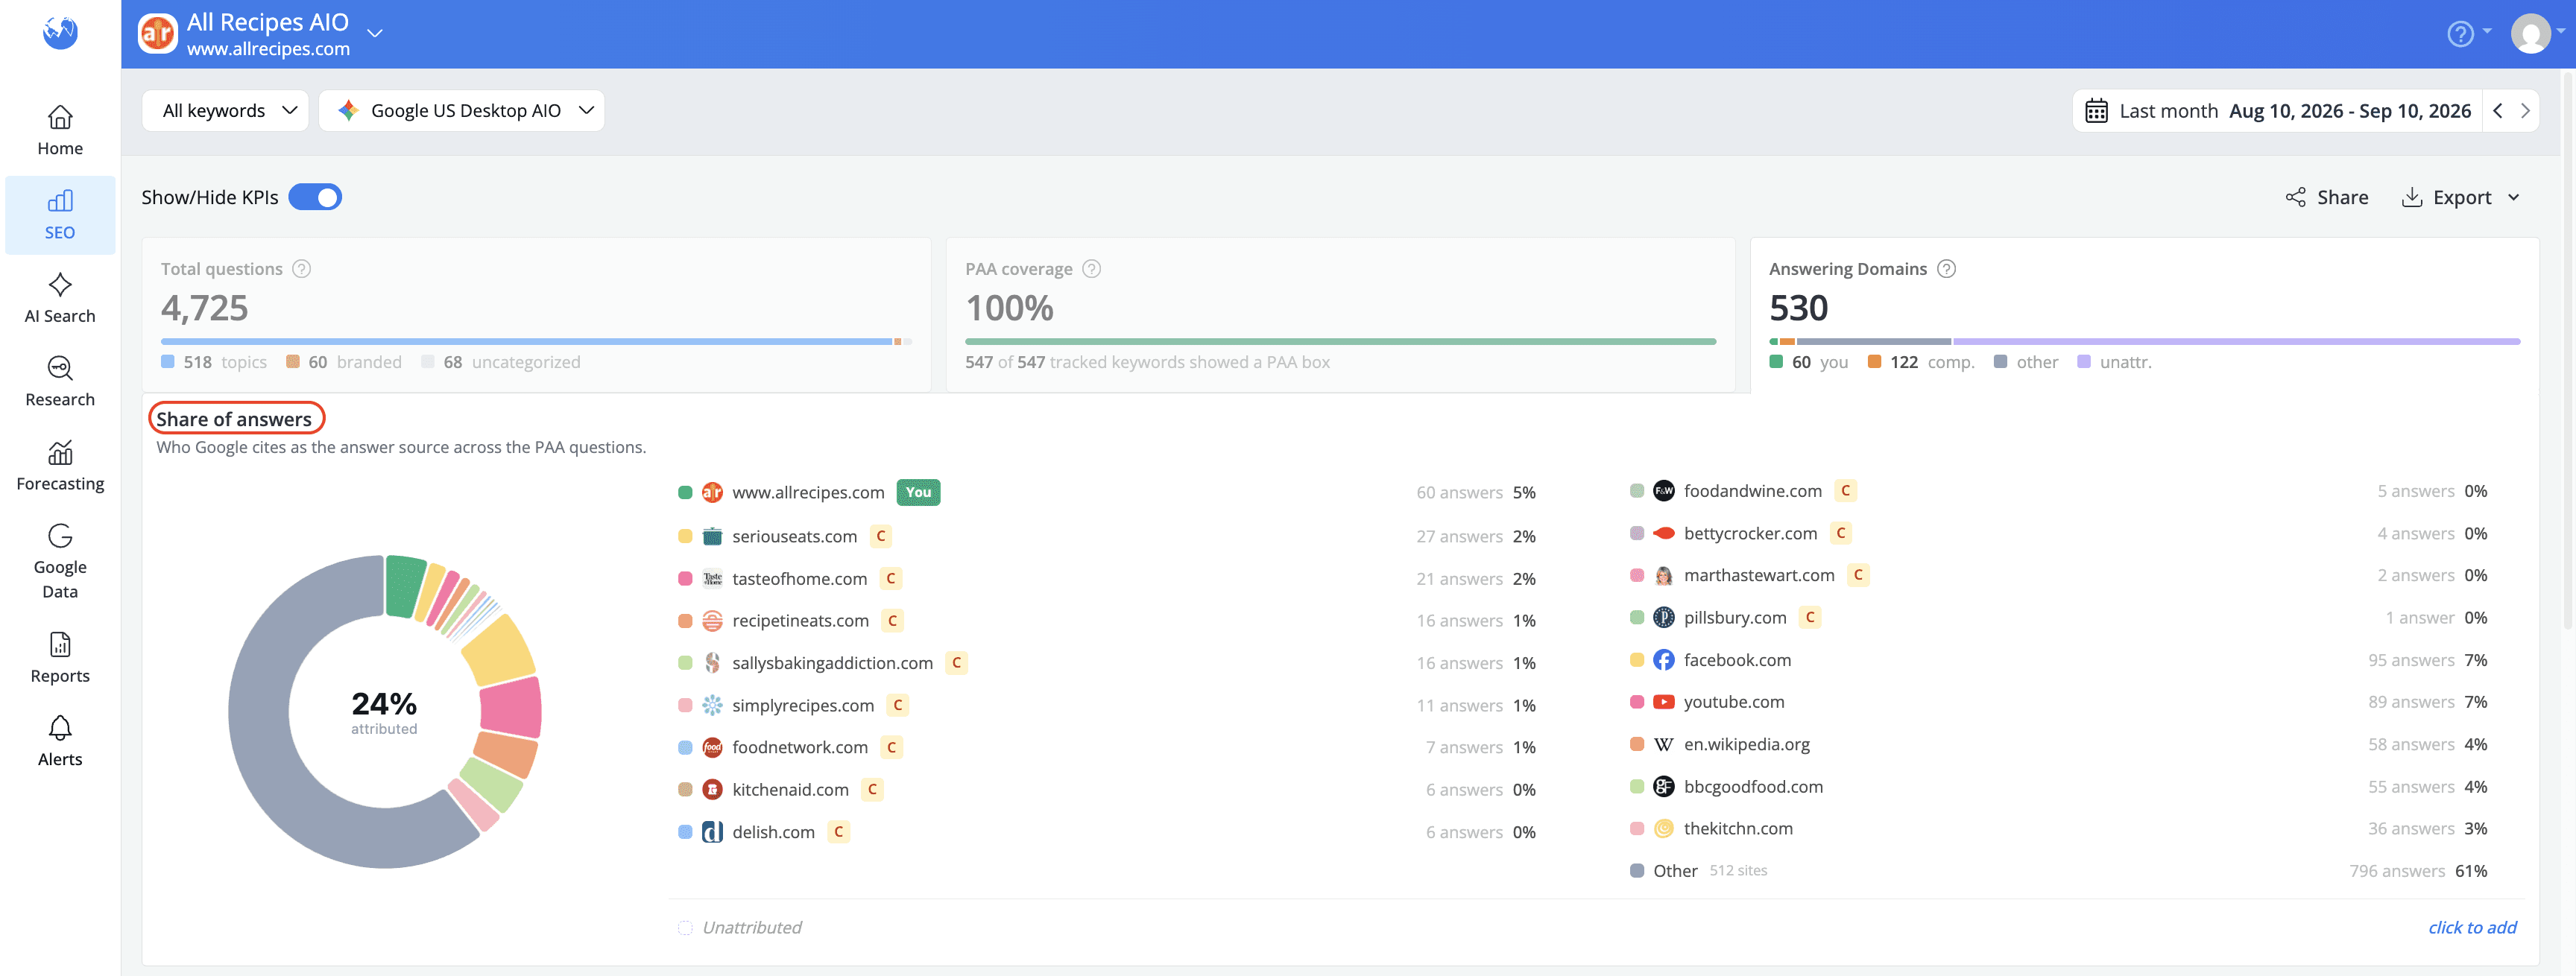
Open their domain drawers to see which topics they cover and how many questions they answer.

You may also find different types of competitors, such as YouTube channels, support forums or publishers. If YouTube dominates a group of questions, for example, that may be a sign that video content is a better format to consider.
5.Audit branded questions
Use the Branded question filter to see the questions Google associates with your brand.
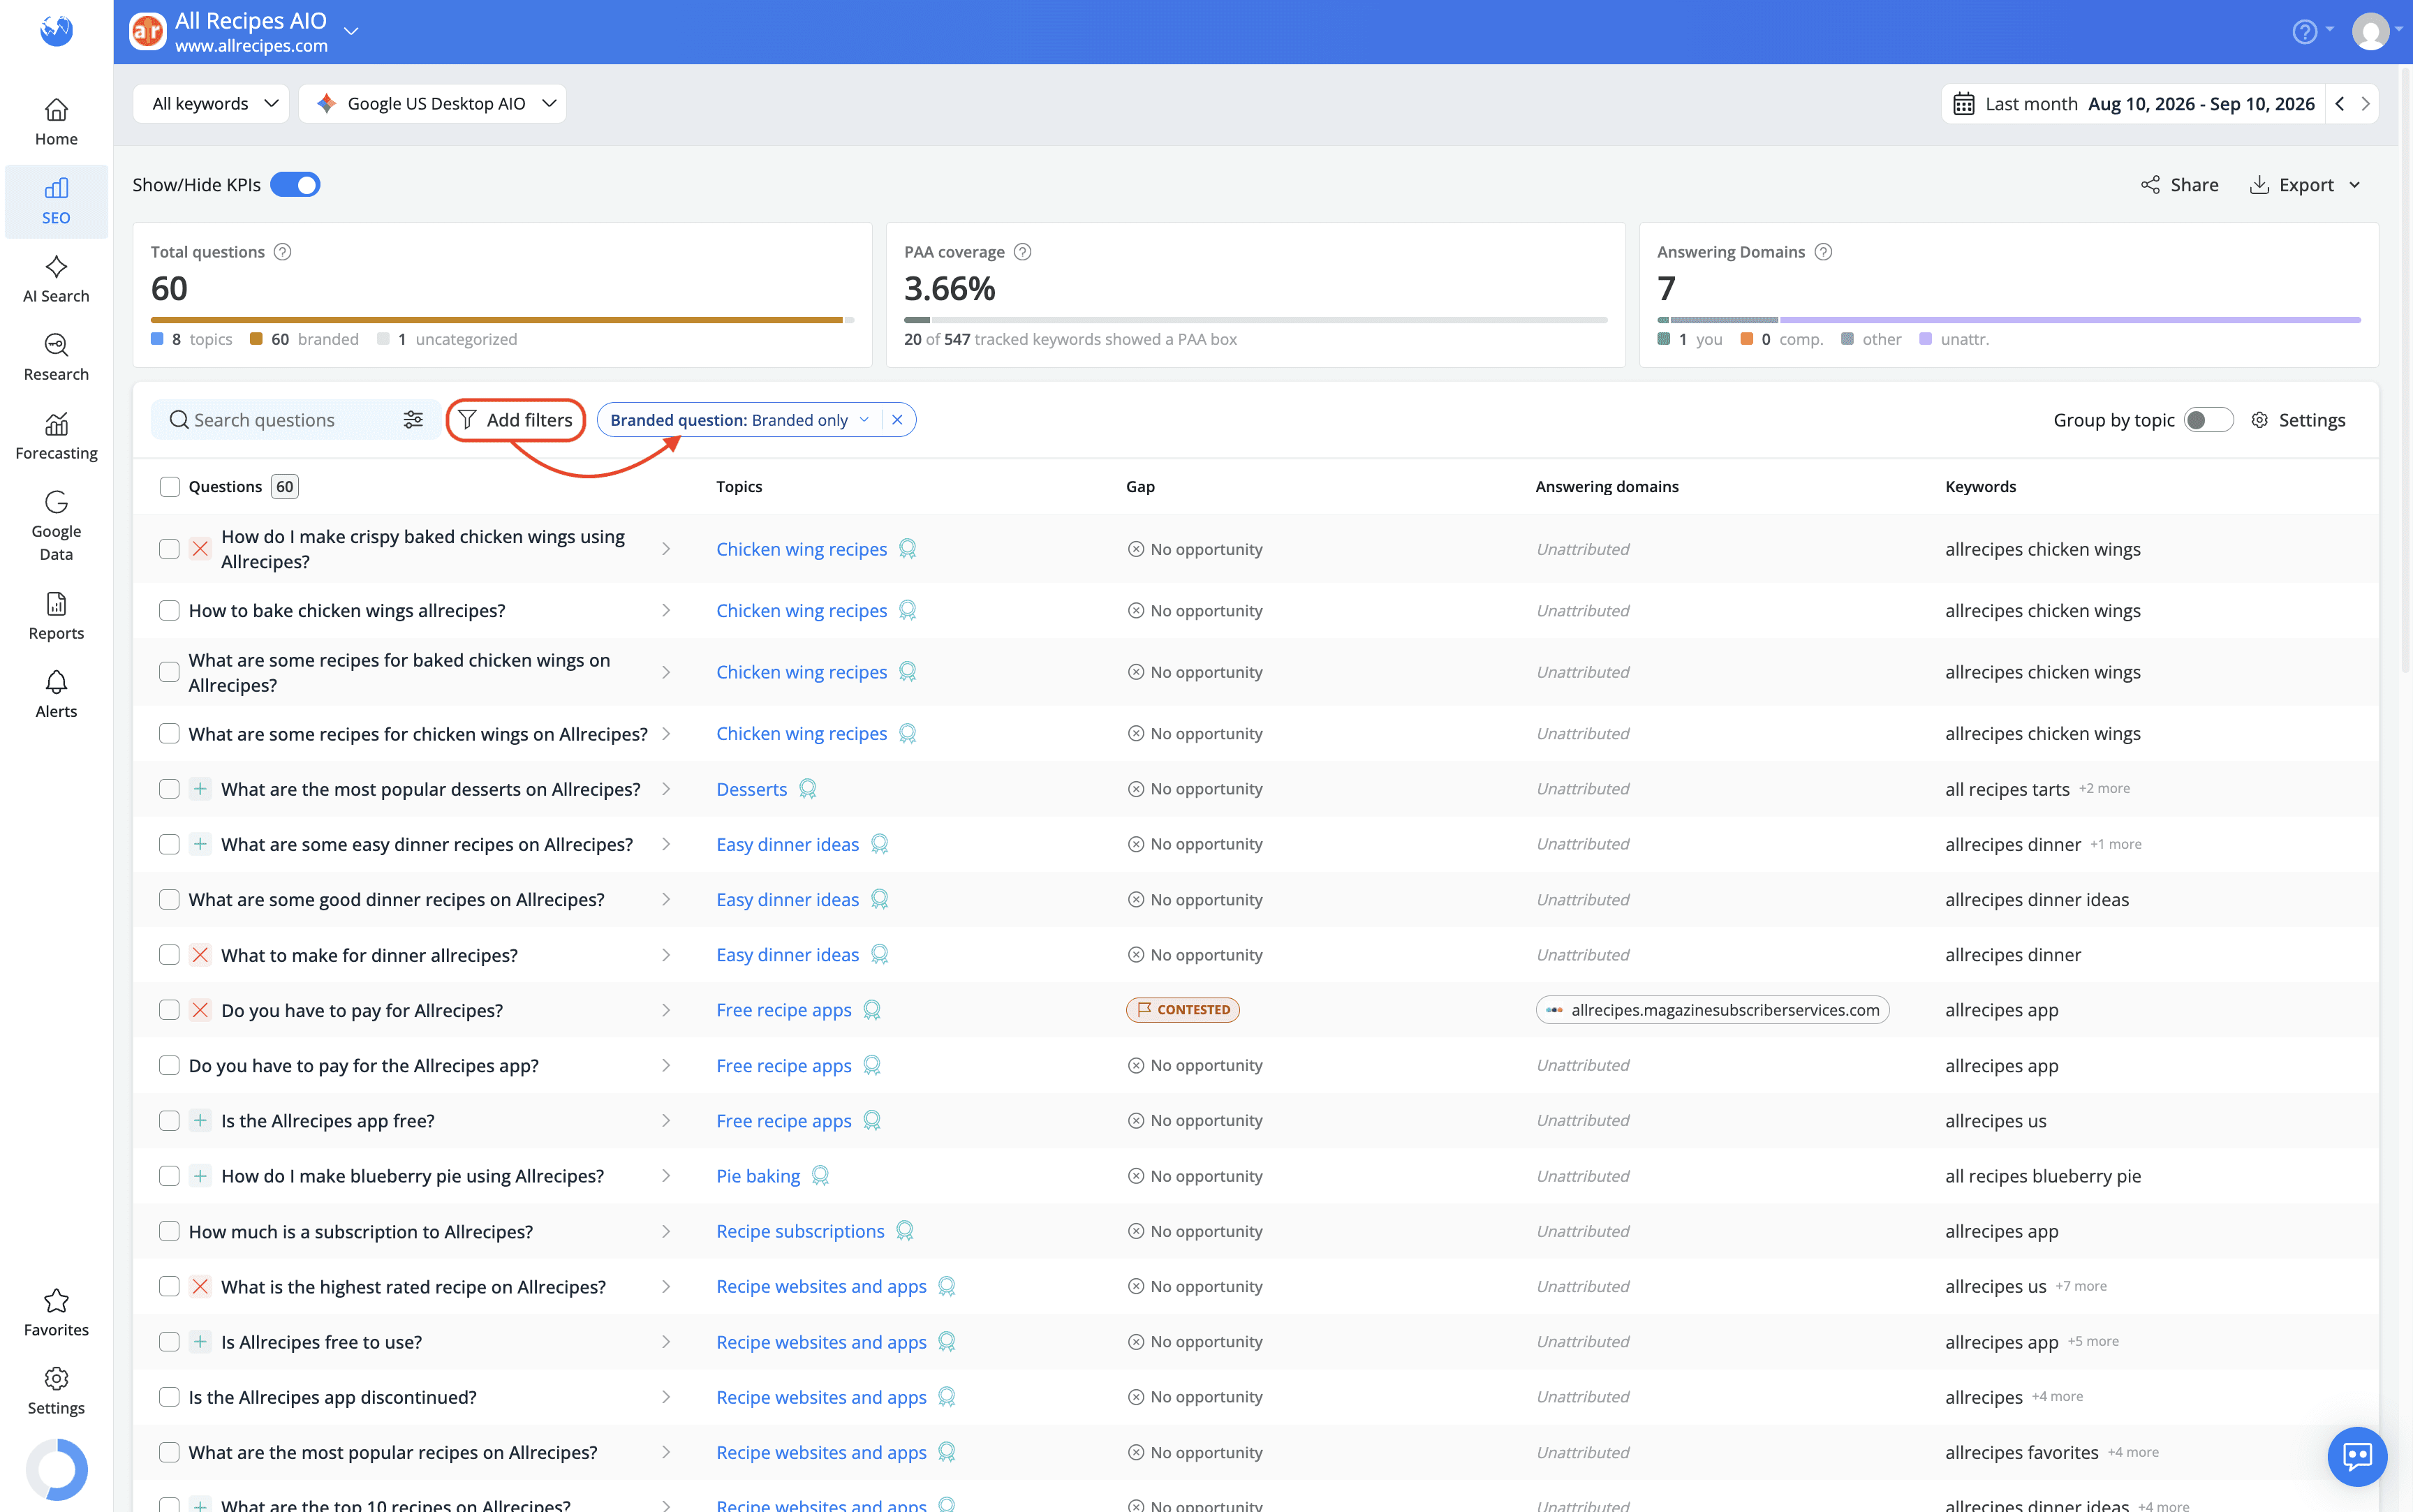
These questions can show what people want to know about your company or products. Check whether your own pages are answering them or whether third-party websites are currently being cited instead.
From PAA questions to AI Search insights
Question data can be useful beyond PAA because the same questions can also help you understand how AI search responds to specific user intents. This makes the Questions report a solid starting point for both traditional SERP analysis and AI visibility work.
Each question drawer includes a Track as prompt button that sends the question to AWR's AI Search prompt tracking.
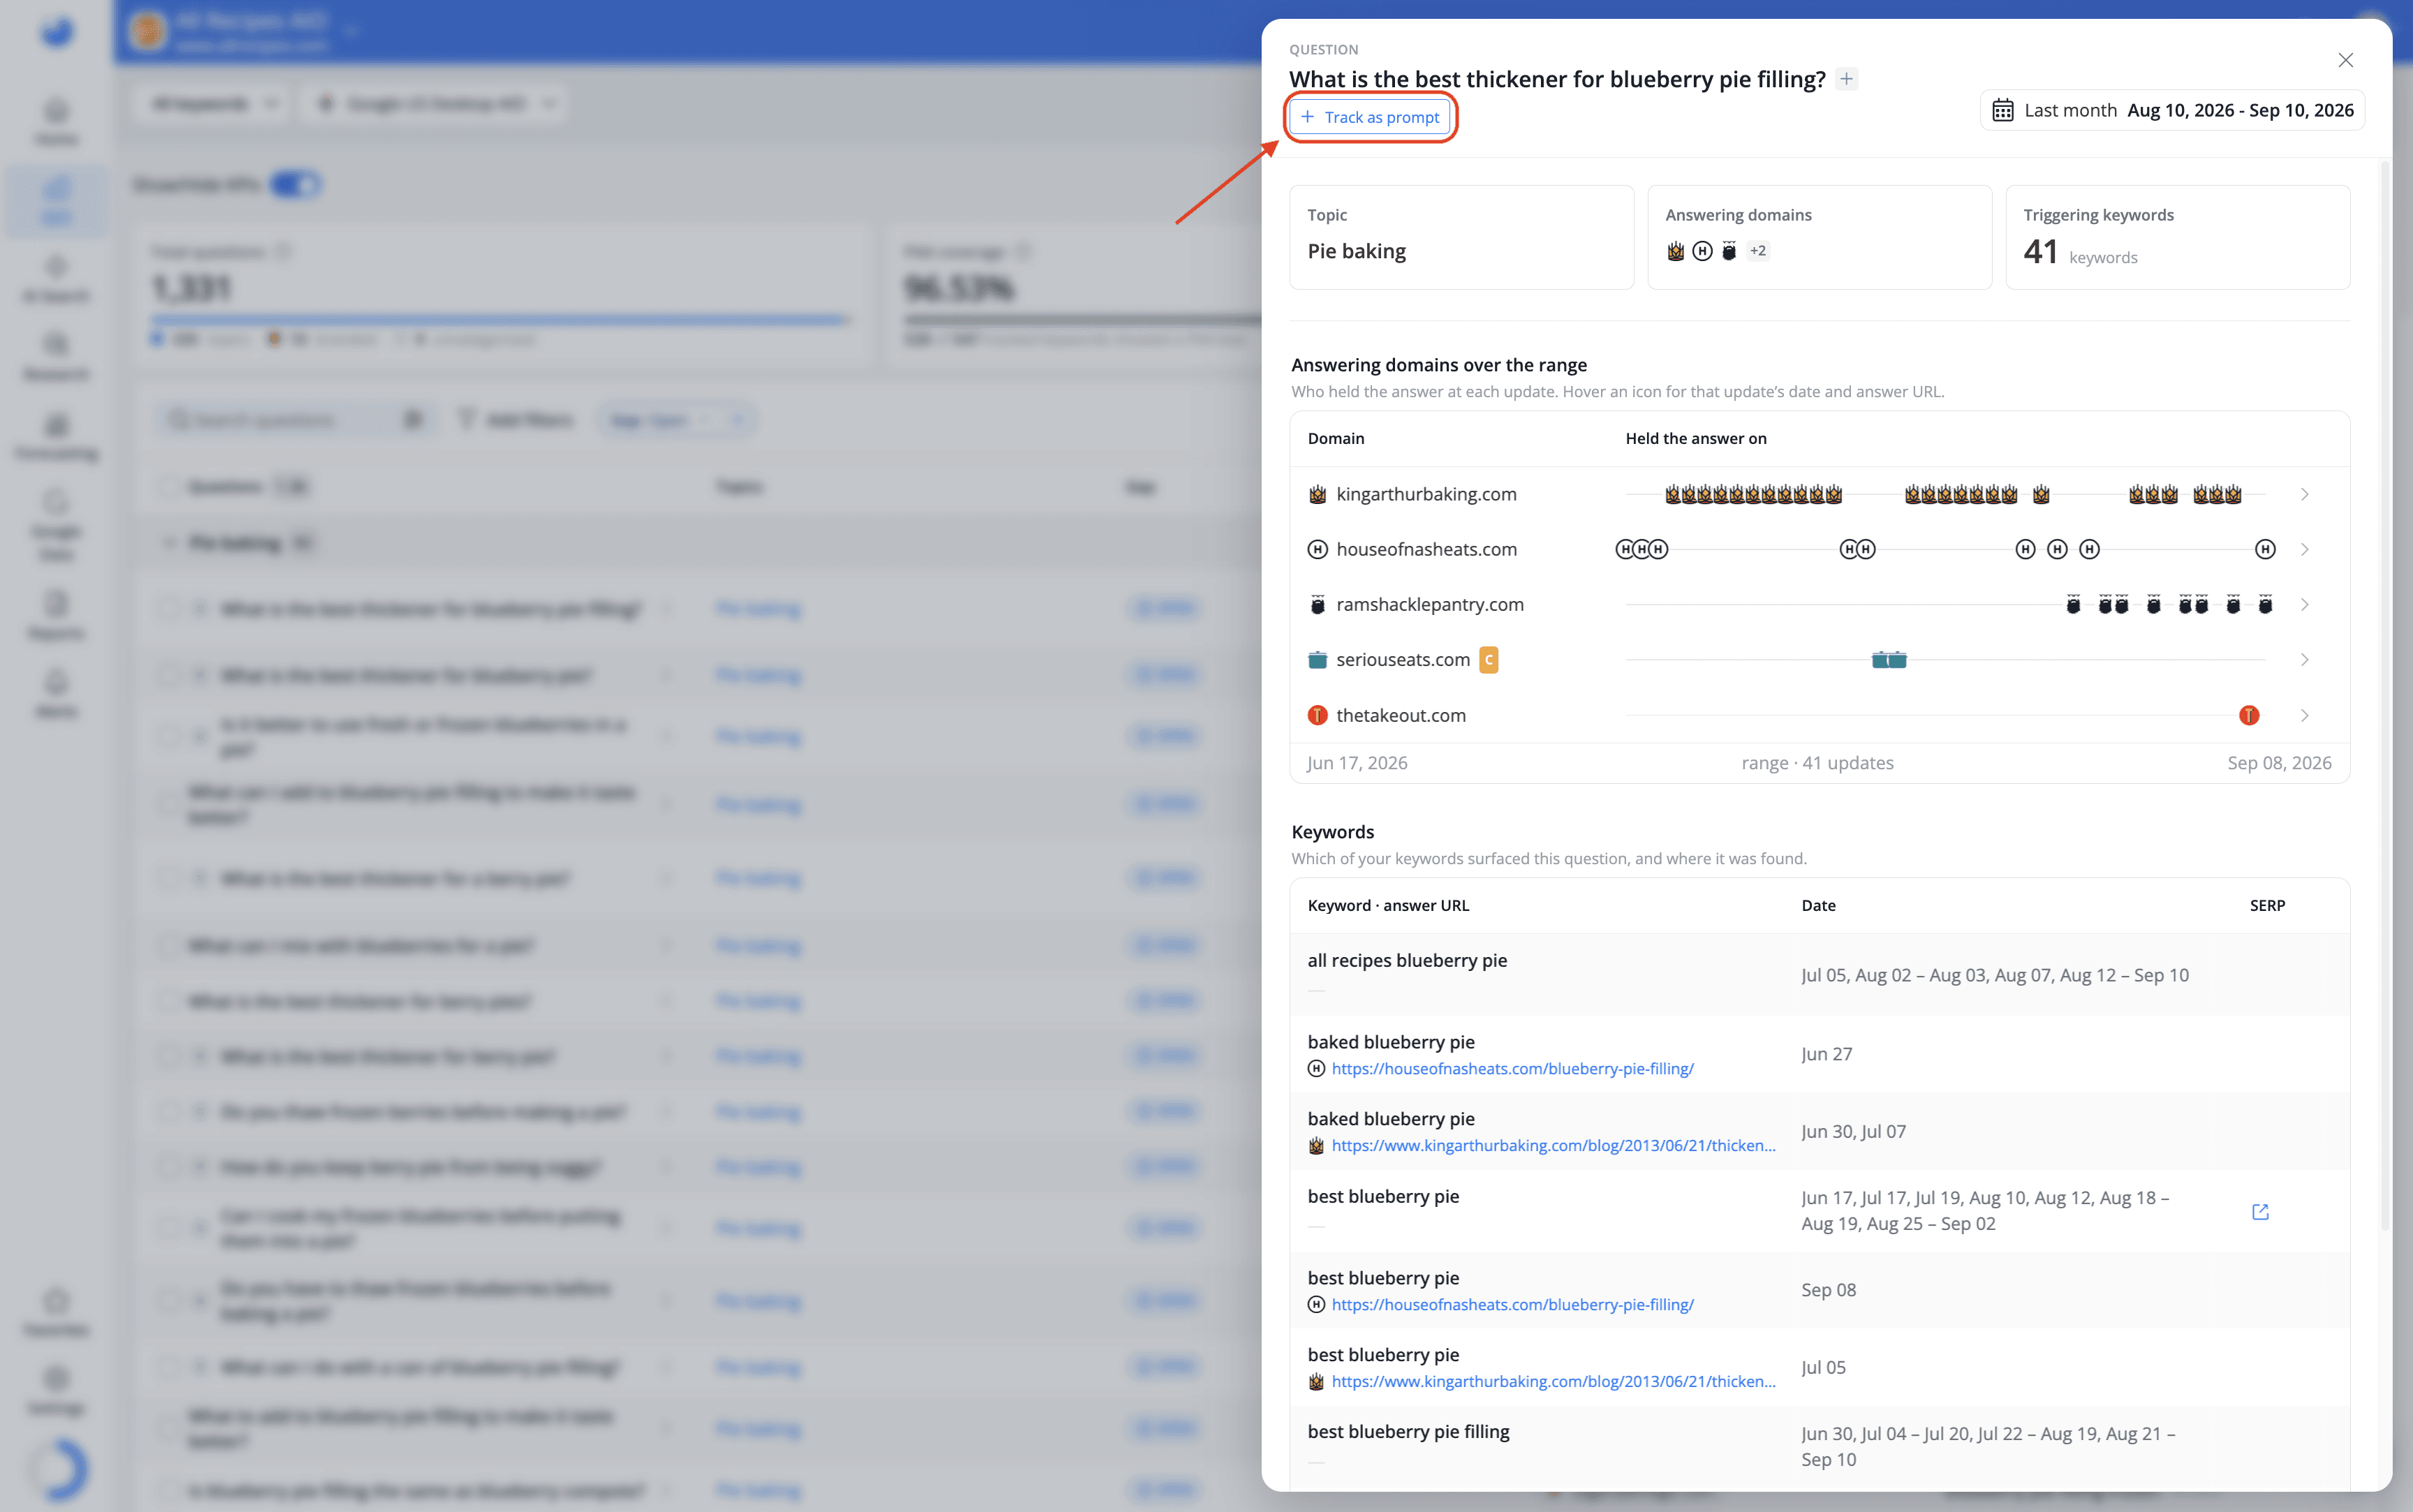
You can then monitor how AI assistants respond to the exact question you are targeting. This works alongside AIO Citation Rank and the rest of AWR's AI visibility tools.
The workflow is straightforward: use the Questions report to find the questions your audience is asking, use the Gap data to identify where you can improve your answers, then track those questions as AI prompts to see whether your content gains visibility in both Google's PAA results and AI search.
Feature availability
The Questions report is available starting with the Agency plan and higher.
Do you have any questions? Don’t hesitate to get in touch and we will keep building the FAQ.
Frequently Asked Questions
What is the Questions report in Advanced Web Ranking?
Where does the question data come from?
How are topics created?
How is the Questions report different from PAA tracking in the Keywords report?
Can I export or share the report?
Does the Questions report help with AI search?
stay in the loop