

Advice and answers from the Advanced Web Ranking Team
Search for articles
Competitor Analysis: The Complete Guide to Who You're Up Against in Search
Learn what your competitors are doing better, why they’re outranking you and where you can find opportunities to improve your search performance.

Another Google update has just rolled out and you spend a morning convinced the client has been affected.
Rankings have taken a hit. There’s no obvious on-page issue and the timing lines up almost perfectly. At first glance, it’s easy to assume the update is behind it.
Then you head to the Top Sites report and check the keywords where your website has dropped out of the SERP.
You compare the Volatility between yesterday’s ranking update and today’s and there’s barely any movement. It’s sitting at a low 1.1, with other affected keywords showing similarly low values.

So, how are your competitors doing if the SERP itself hasn’t really shifted?
The only site that really moved was your client’s. That’s a pretty good sign the drop wasn’t caused by a broader Google update reshuffling the SERP, but by something specific to the site itself.
You were one email away from blaming Google when the real clue was sitting in the SERP the whole time.
TL;DR: A Simple Workflow for Understanding Your SEO Competitors
Start by figuring out who you’re really competing with in search. The Market Share report shows which websites are taking a bigger share of the potential traffic, while the Keyword Gap report reveals gaps between your rankings and your competitors’, including keywords where they rank higher or you don’t rank at all.
Once you know where they’re ahead, use the SERP Volatility report to compare how your site and your competitors have evolved over time and pinpoint when they overtook you.
From there, the SERP Similarity report shows what changed around that time, from shifts in the results to changes in AI Overviews and other SERP Features.
SEO Troubleshooting Starts With Your Competitors
Now comes the harder part: explaining why their competitors are still holding their positions while their site has slipped. Your client wants to know what they’re doing differently and why it’s working.
To answer that, you need to take a closer look at who you’re actually competing against.
Sure, your client probably already has a list of competitors they know about and asked you to track. But the SERP doesn’t stand still.

Competitors come and go, new domains appear and the sites you were watching a few months ago might not be the ones you need to worry about today.
Understanding your Market Share data
The Market Share report answers that question by showing you which websites are competing with you across the keywords you’re tracking. It identifies the websites appearing in those SERPs and groups them by their main domain into one list.

This gives you a much clearer view of who you’re actually competing with in search, including competitors you may not have been aware of before.
If you spot a competitor you’d like to track, simply check the box next to their domain and click “Add to project” in the pop-up that appears at the bottom of the report. Once added, they’ll be tagged in yellow as a competitor across your reports, making them easy to spot.

You may also come across results, such as Wikipedia, that aren’t really competitors or relevant to what you’re tracking. In that case, you can easily exclude them from your reports by clicking “Ignore domains” in the pop-up.
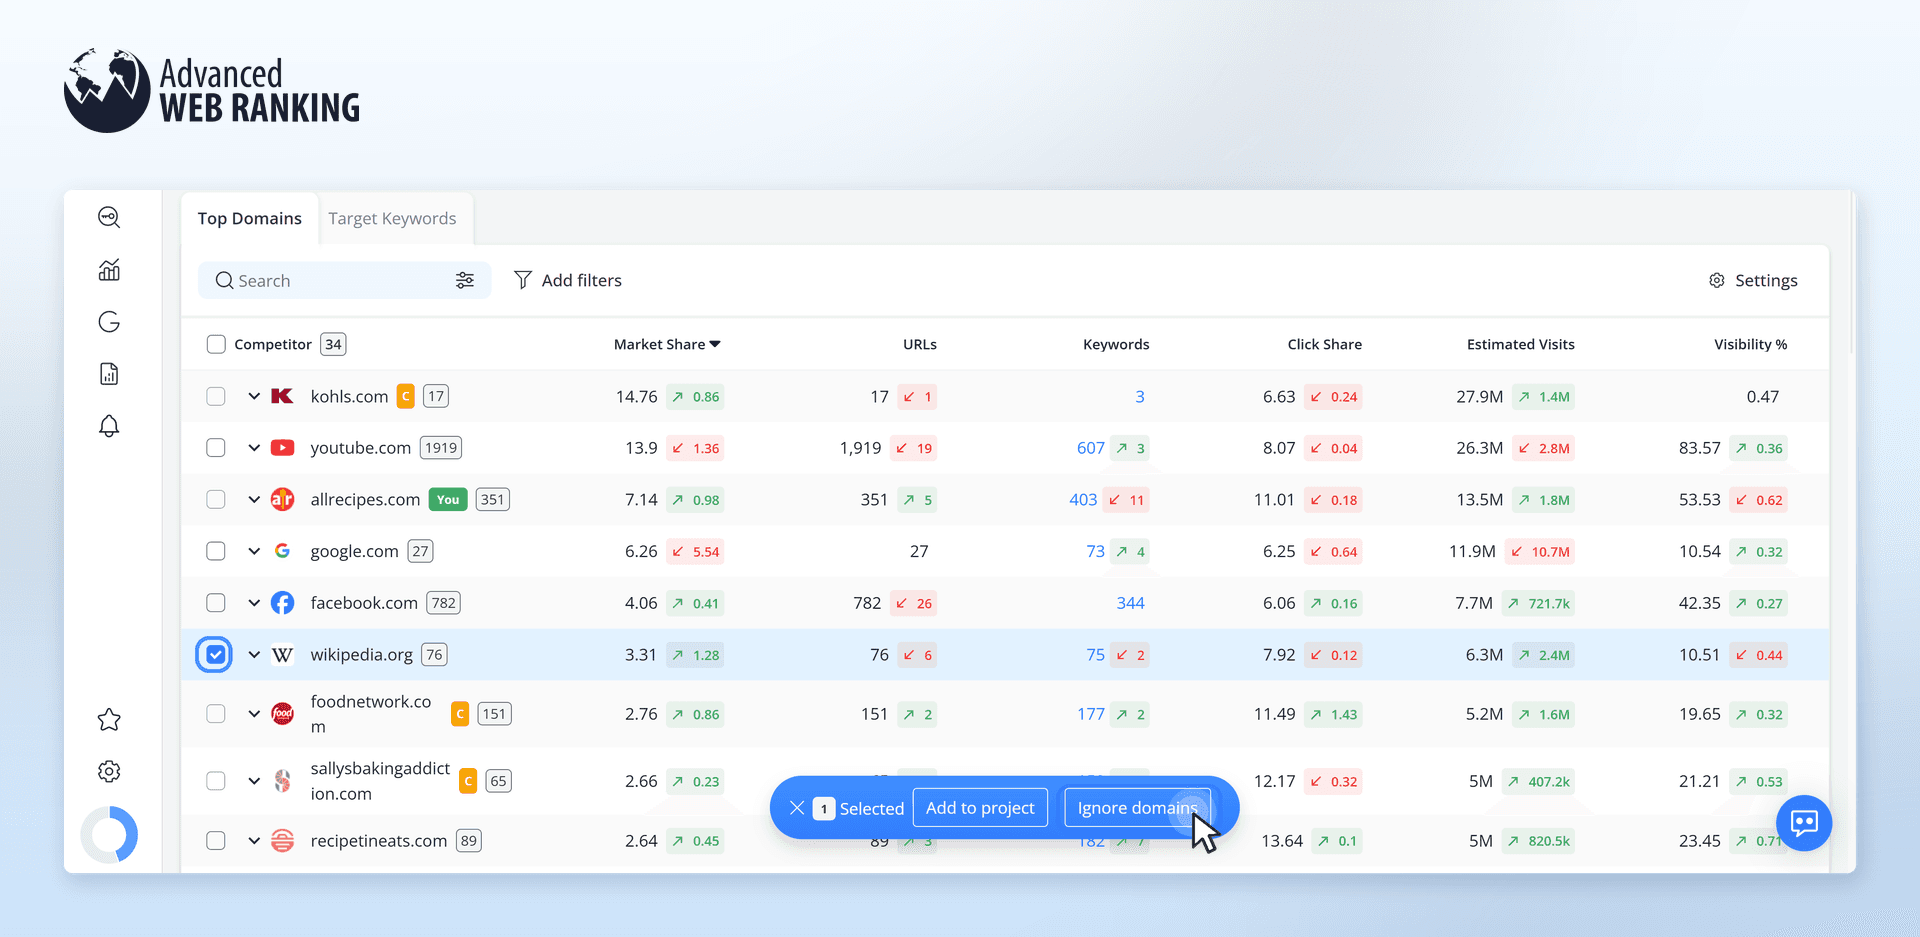
An easy way to think about Market Share is that it shows how much of the overall potential traffic belongs to you compared to your competitors.

The chart also helps you compare Market Share with other metrics, helping you get a better sense of what’s behind each website’s performance.
You can compare Market Share with Visibility Percent, which shows how visible a website is across the SERPs based on where it ranks.
In this example, spendwithpennies.com has lower visibility but a higher Market Share, while sallysbakingaddiction.com is more visible but captures a smaller share of the potential traffic. This shows that being more visible doesn’t always mean getting more traffic.

spendwithpennies.com may simply be performing better for keywords with higher traffic potential, while sallysbakingaddiction.com may be more visible for keywords that bring in less traffic.
You can also compare Market Share with the number of URLs a website ranks for to see how much of its content is showing up in search.
Here, spendwithpennies.com ranks with 24 URLs and has a Market Share of 5.17, while sallysbakingaddiction.com ranks with 37 URLs but has a slightly lower Market Share of 4.98. This shows that having more pages ranking doesn’t always mean getting a bigger share of the potential traffic.

You can also look at:
Ranking Keywords: See how many keywords each website ranks for and how wide its presence is in search.
Click Share: See how many of the available clicks each website is getting and who is attracting more clicks.
Estimated Visits: See how much traffic each website could be getting from search and compare traffic potential.
Together, these metrics help you see what’s actually driving each website’s visibility and traffic, rather than looking at rankings alone.
Use the Keyword Gap report to see where competitors rank higher
Now that you know who your competitors are, you can see how they’re ranking for the keywords you’re tracking. Head to the Keyword Gap report and use the dropdown in the top-left corner to add the competitors you want to compare against your website.

Once you’ve applied the changes, you can see which keywords you and your competitors are both ranking for and how much your keyword coverage overlaps.
For example, in the Keyword Intersection chart, allrecipes.com ranks for 515 keywords, while marthastewart.com ranks for 202.

The overlapping areas show the keywords they have in common, making it easy to see where you’re competing for the same searches.
The Common Keywords chart shows how many keywords each pair of competitors ranks for in common; the deeper the color, the more keywords the two websites share.

Click any panel to filter the report and see the keywords you share with a competitor or even the keywords two competitors have in common.

You can explore the data from different angles, making it easier to spot where you’re doing well and where there’s room to improve.
We saw earlier in the Market Share report that sallysbakingaddiction.com is performing better than delish.com. To understand why, we can compare the two in the Keyword Gap report.
Simply click their panel in the Common Keywords chart to apply the “Common keywords” filter and see how differently the two websites rank for the same keywords.

Here, we can see that sallysbakingaddiction.com consistently ranks higher than delish.com, helping explain its stronger Market Share performance.
Compare Your Ranking Evolution With Your Competitors Using SERP Volatility
You now know which keywords your competitors rank higher for, but how can you use that information to improve your client’s performance?
A good place to start is by looking at how both websites’ rankings have evolved for a specific keyword.
In this example, we’ll compare marthastewart.com, which ranked in Position 2 for “chocolate recipes” on October 5, with allrecipes.com, which ranked in Position 5 for the same keyword.

Next, head to the SERP Volatility report and find the competitor you spotted in the Keyword Gap report. Click “Only” next to their domain to focus on their data and get a clearer picture of how their rankings have changed over time.

Here, we can see that marthastewart.com jumped from Position 36 on October 4 to Position 2 on October 5; a significant ranking improvement in just one day.

Next, check the box next to allrecipes.com. You’ll notice that multiple URLs ranked during the selected period.

To keep the comparison focused, we’ll uncheck the other URLs and keep only the one that was ranking in the SERP at the same time as marthastewart.com on October 5.

Looking at the evolution in time, the difference is pretty clear. allrecipes.com gradually slipped from Position 5 to around Position 38, while marthastewart.com hovered in the 30s before making a big jump to Position 2 on October 5, overtaking allrecipes.com.
This helps you see when the gap between you and a competitor actually started and what happened next. You can spot the exact moment they overtook you, then dig into what changed around that time and what might have helped them move ahead.
Find what higher-ranking competitors do better with SERP Similarity
Now that you know exactly when a competitor started outranking you, you can take a closer look at what changed in the SERP. In the previous chart, we saw that marthastewart.com moved ahead between the October 4 and October 5 ranking updates, so we’ll compare the SERPs from those two dates.
To do this, we’ll head to the SERP Similarity report and select October 4 and October 5 as the comparison range.
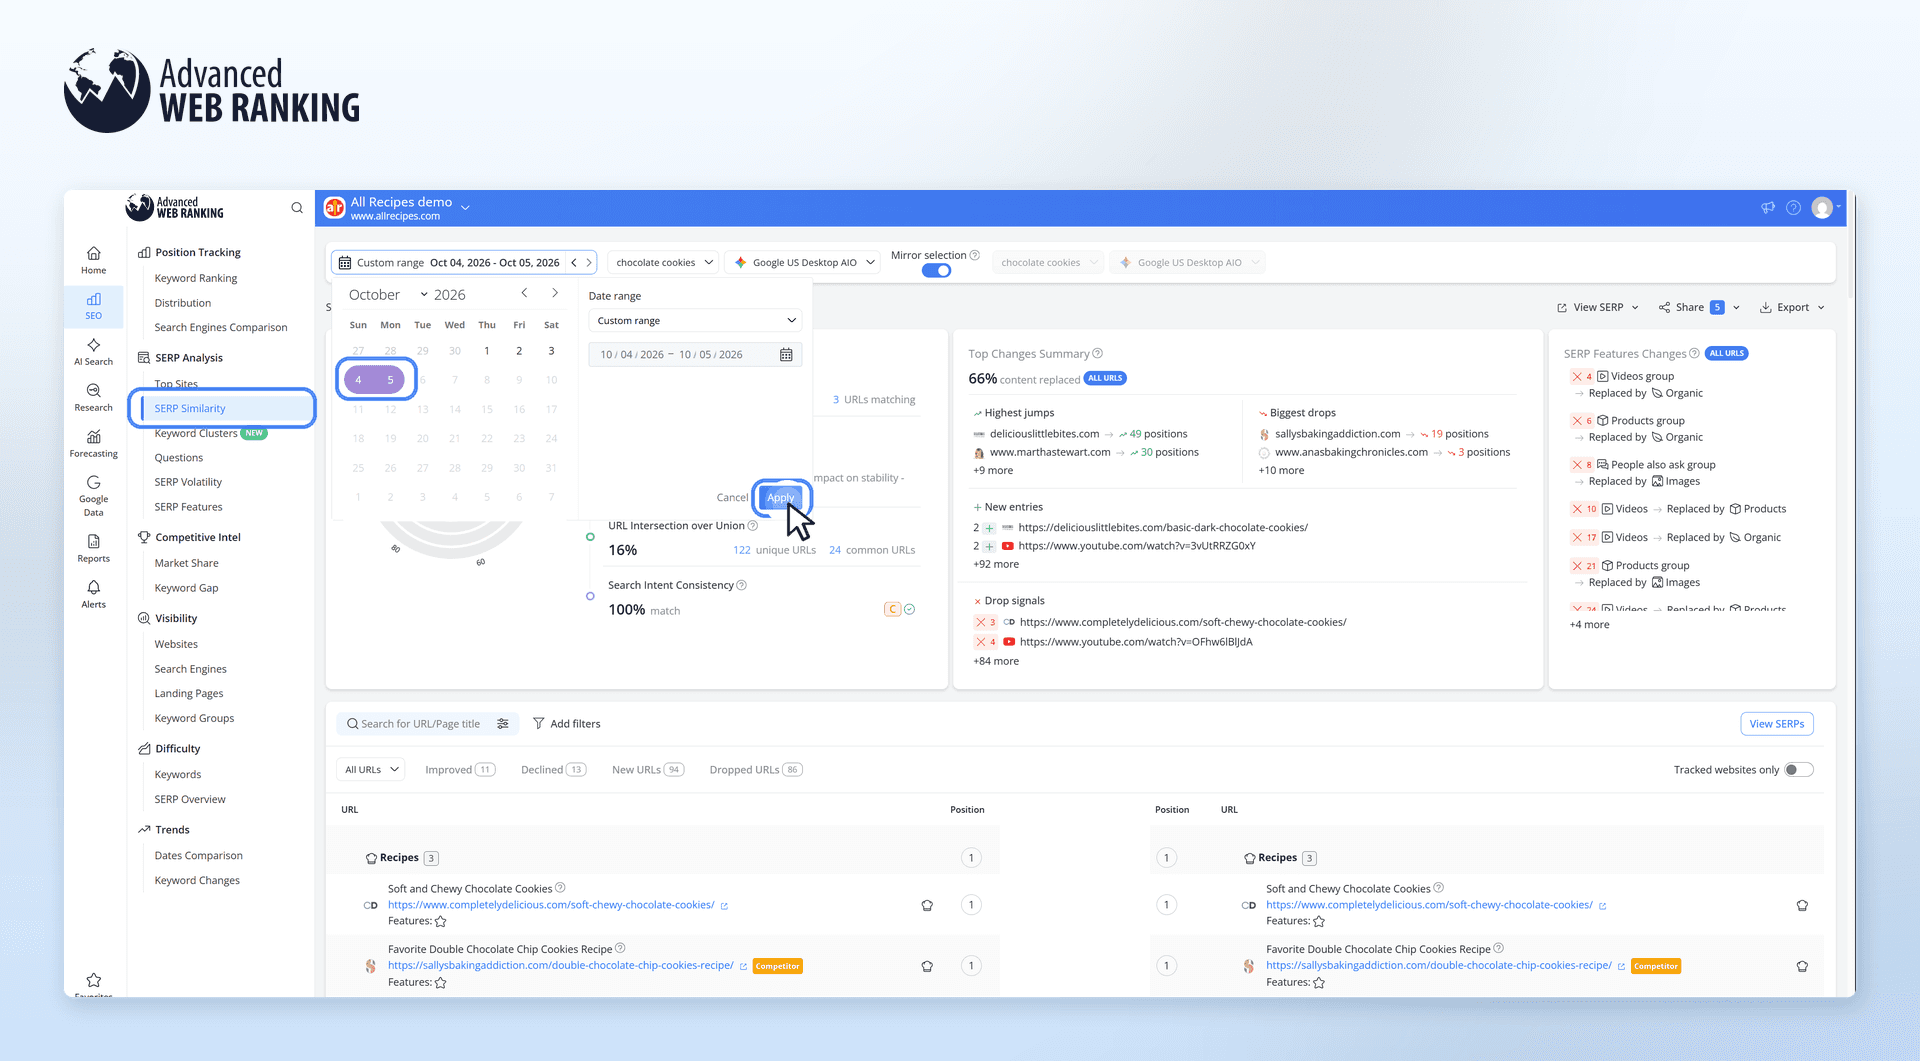
First, let’s look at allrecipes.com. It moved from Position 16 on October 4 to Position 5 on October 5, although a different URL was ranking.

marthastewart.com saw a much bigger jump, moving from Position 36 to Position 2 and also appearing within the AI Overview.

This suggests that both sites improved, but marthastewart.com gained significantly more visibility. Its appearance in the AI Overview also points to a change in how Google was presenting and prioritizing its content for that search.
If you do this across several keywords, you can start to see whether there’s a bigger pattern behind why a competitor is ranking better.
Maybe they’re showing up more often in AI Overviews, moving up with certain types of pages or consistently overtaking you after specific updates. This gives you a better idea of what’s working for them and what you might want to look at on your own site.
If you’d like to dig deeper into comparing SERPs and spotting what changed between ranking updates, check out our guide on using the Side-by-Side SERP Comparison feature.
The Top Changes Summary also gives you a quick look at who’s moving up, who’s dropping and which new pages are starting to show up in the SERP.
Here, marthastewart.com is one of the Highest Jumps, moving up around 30 positions, which lines up with the ranking change we spotted earlier. Meanwhile, sallysbakingaddiction.com is among the Biggest Drops, falling around 19 positions.

New Entries show you pages that have just made their way into the SERP, so you can spot new competitors or content that’s starting to perform well. Drop Signals show the opposite: pages that were there before but have now disappeared.
For example, clicking on these changes shows that, for “chocolate cookies,” Google stopped displaying some Video and Product SERP features between the two updates.

Looking at these together makes it much easier to see who’s gaining ground, who’s losing it and which competitors might be worth digging into further.
Turn Competitor Data Into Your Next Move
Competitor analysis isn’t just about knowing who ranks above you. It’s about understanding where they’re performing better, when they started pulling ahead and what changed in the SERP along the way. Pasted text
By connecting the Market Share, Keyword Gap, SERP Volatility, and SERP Similarity reports, you can turn competitor data into a clear workflow that takes you from finding who you’re competing with to understanding what changed when they moved ahead.

Instead of jumping between reports and digging through data that isn’t relevant to your client, each step builds on the last, keeping you focused on what your competitors are doing better and why.
Do you have any questions? Don’t hesitate to get in touch and we will keep building the FAQ.
Frequently Asked Questions
How can I tell if a competitor is benefiting from a change in Search Intent?
How can I compare my competitors in AI search?
Which SERP Features are my competitors doing better in?
stay in the loop