
Advice and answers from the Advanced Web Ranking Team
Search for articles
>
>
Take Your SEO Analysis to the Next Level with the Enhanced Keyword Ranking KPIs
Explore enhanced Keyword Ranking KPIs to track AI and organic visibility, analyze SERP features and uncover new opportunities to grow your search performance.

In today’s SEO landscape, it’s no longer enough to track only traditional search rankings. AI-generated answers are becoming increasingly important and understanding your brand’s presence across both organic and AI-driven results is essential.
The enhanced Keyword Ranking report gives you a comprehensive view of your performance, letting you compare traditional rankings with AI results, analyze SERP features and monitor search volume trends.
With these updates, you can uncover hidden opportunities, see exactly where your site is performing orr missing out and make data-driven decisions to improve your overall search visibility and impact.
Let's check out what's new.
Web Search and AI Search Side by Side
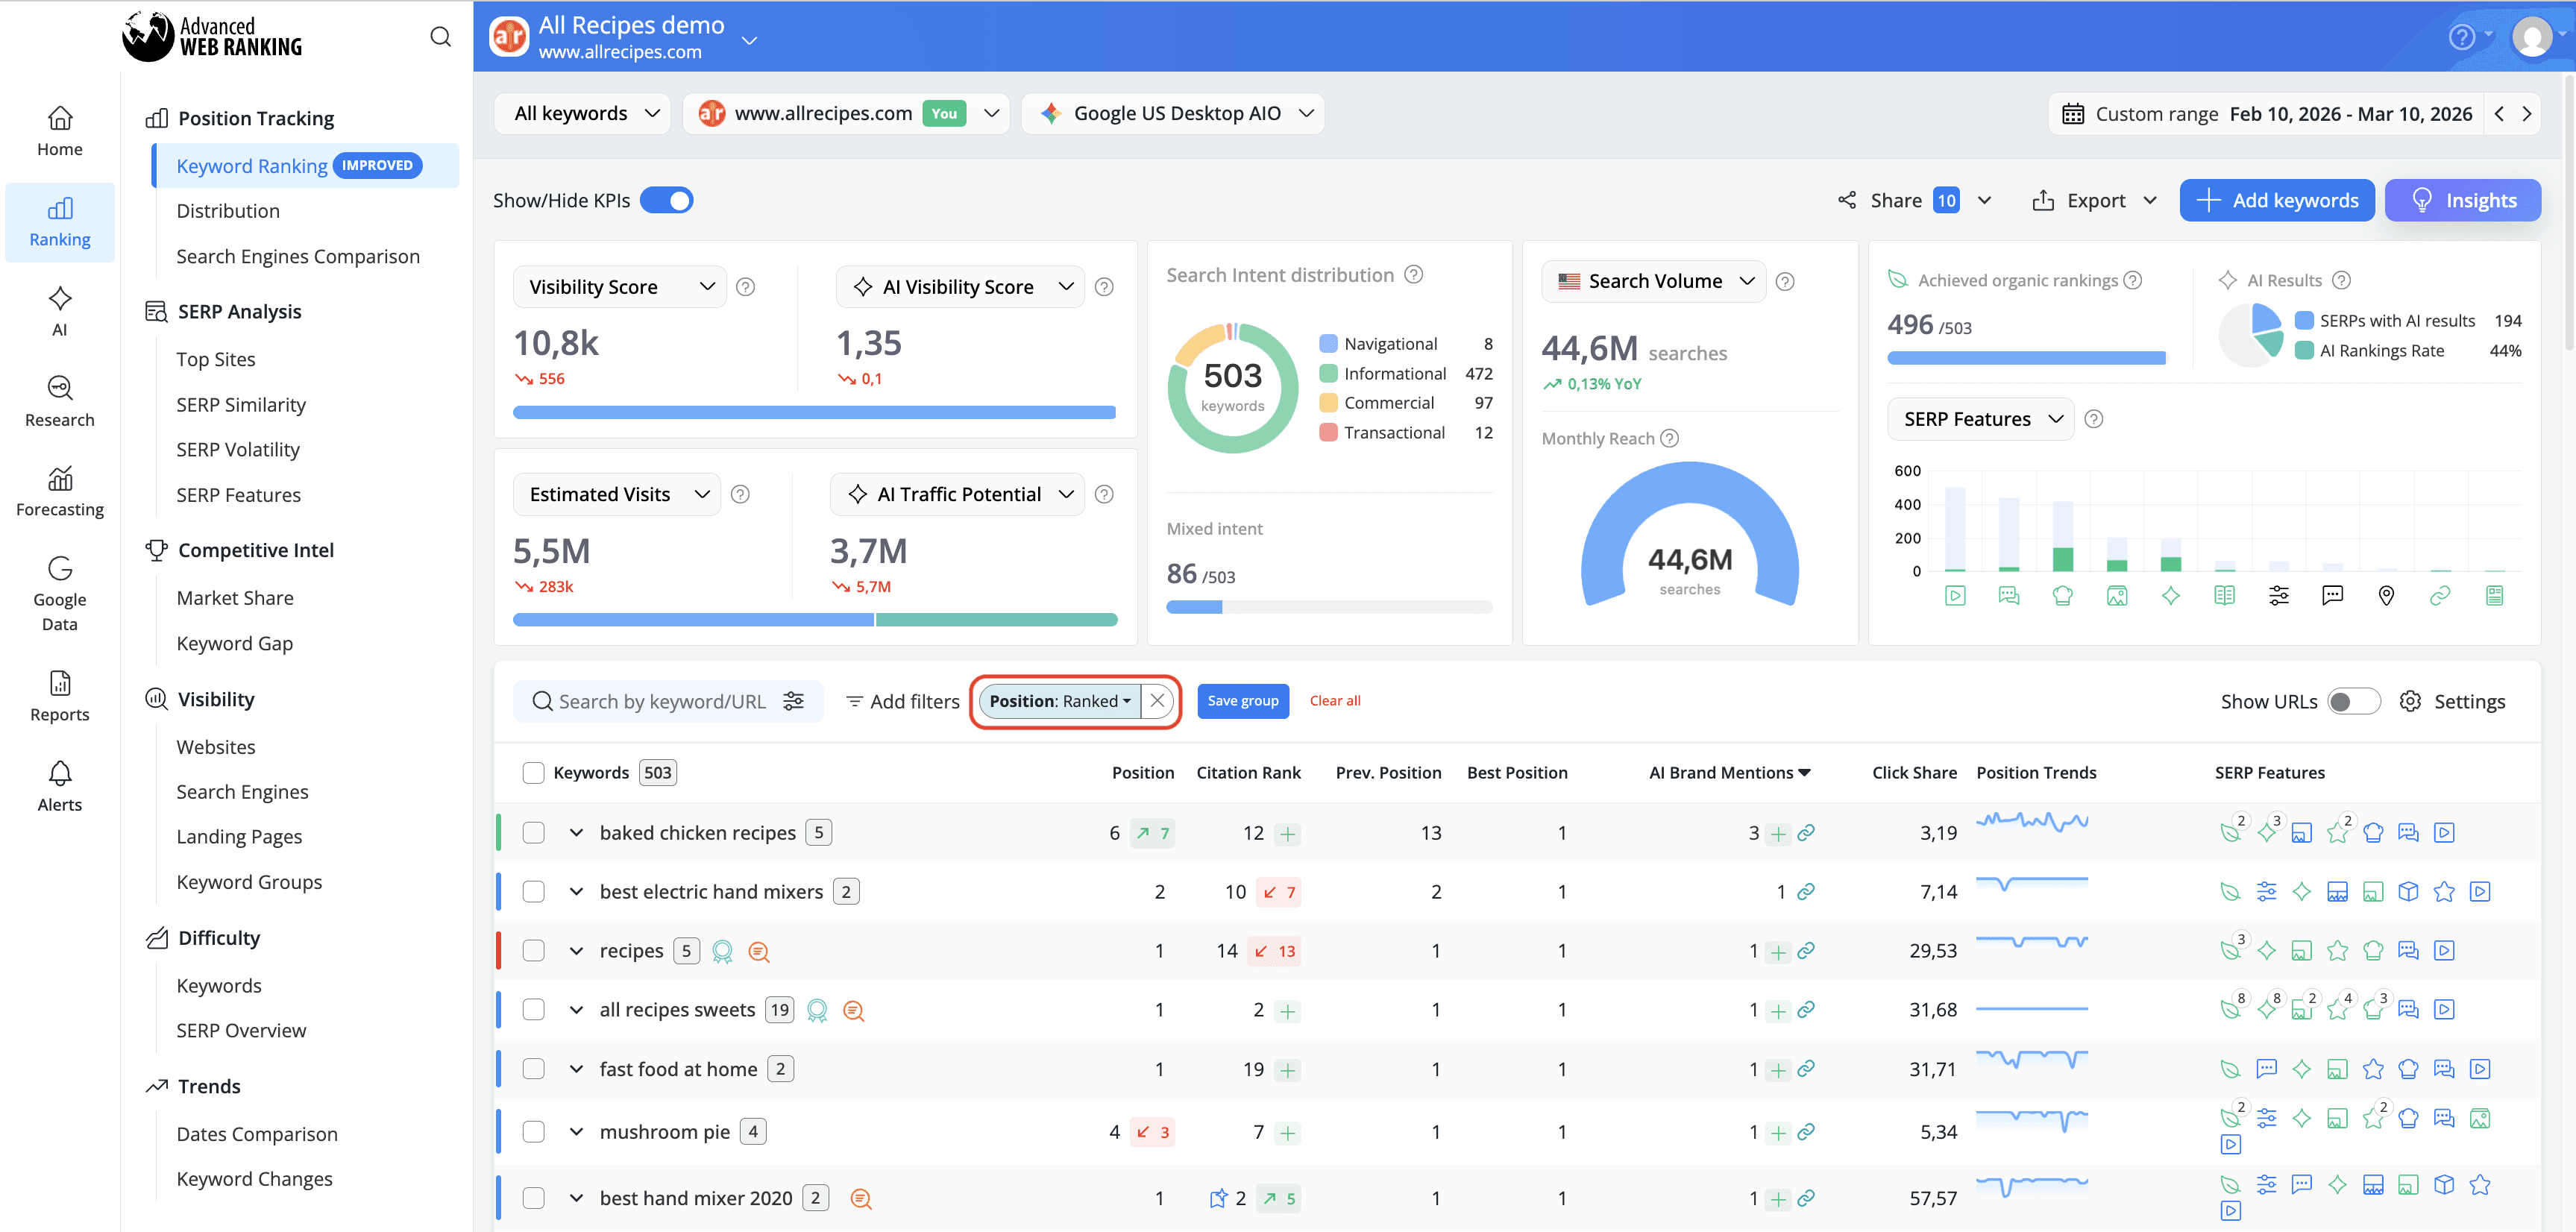
The Keyword Ranking KPIs now provide a unified view of Traditional Search and AI Search performance, allowing you to compare key metrics side by side in a single place.
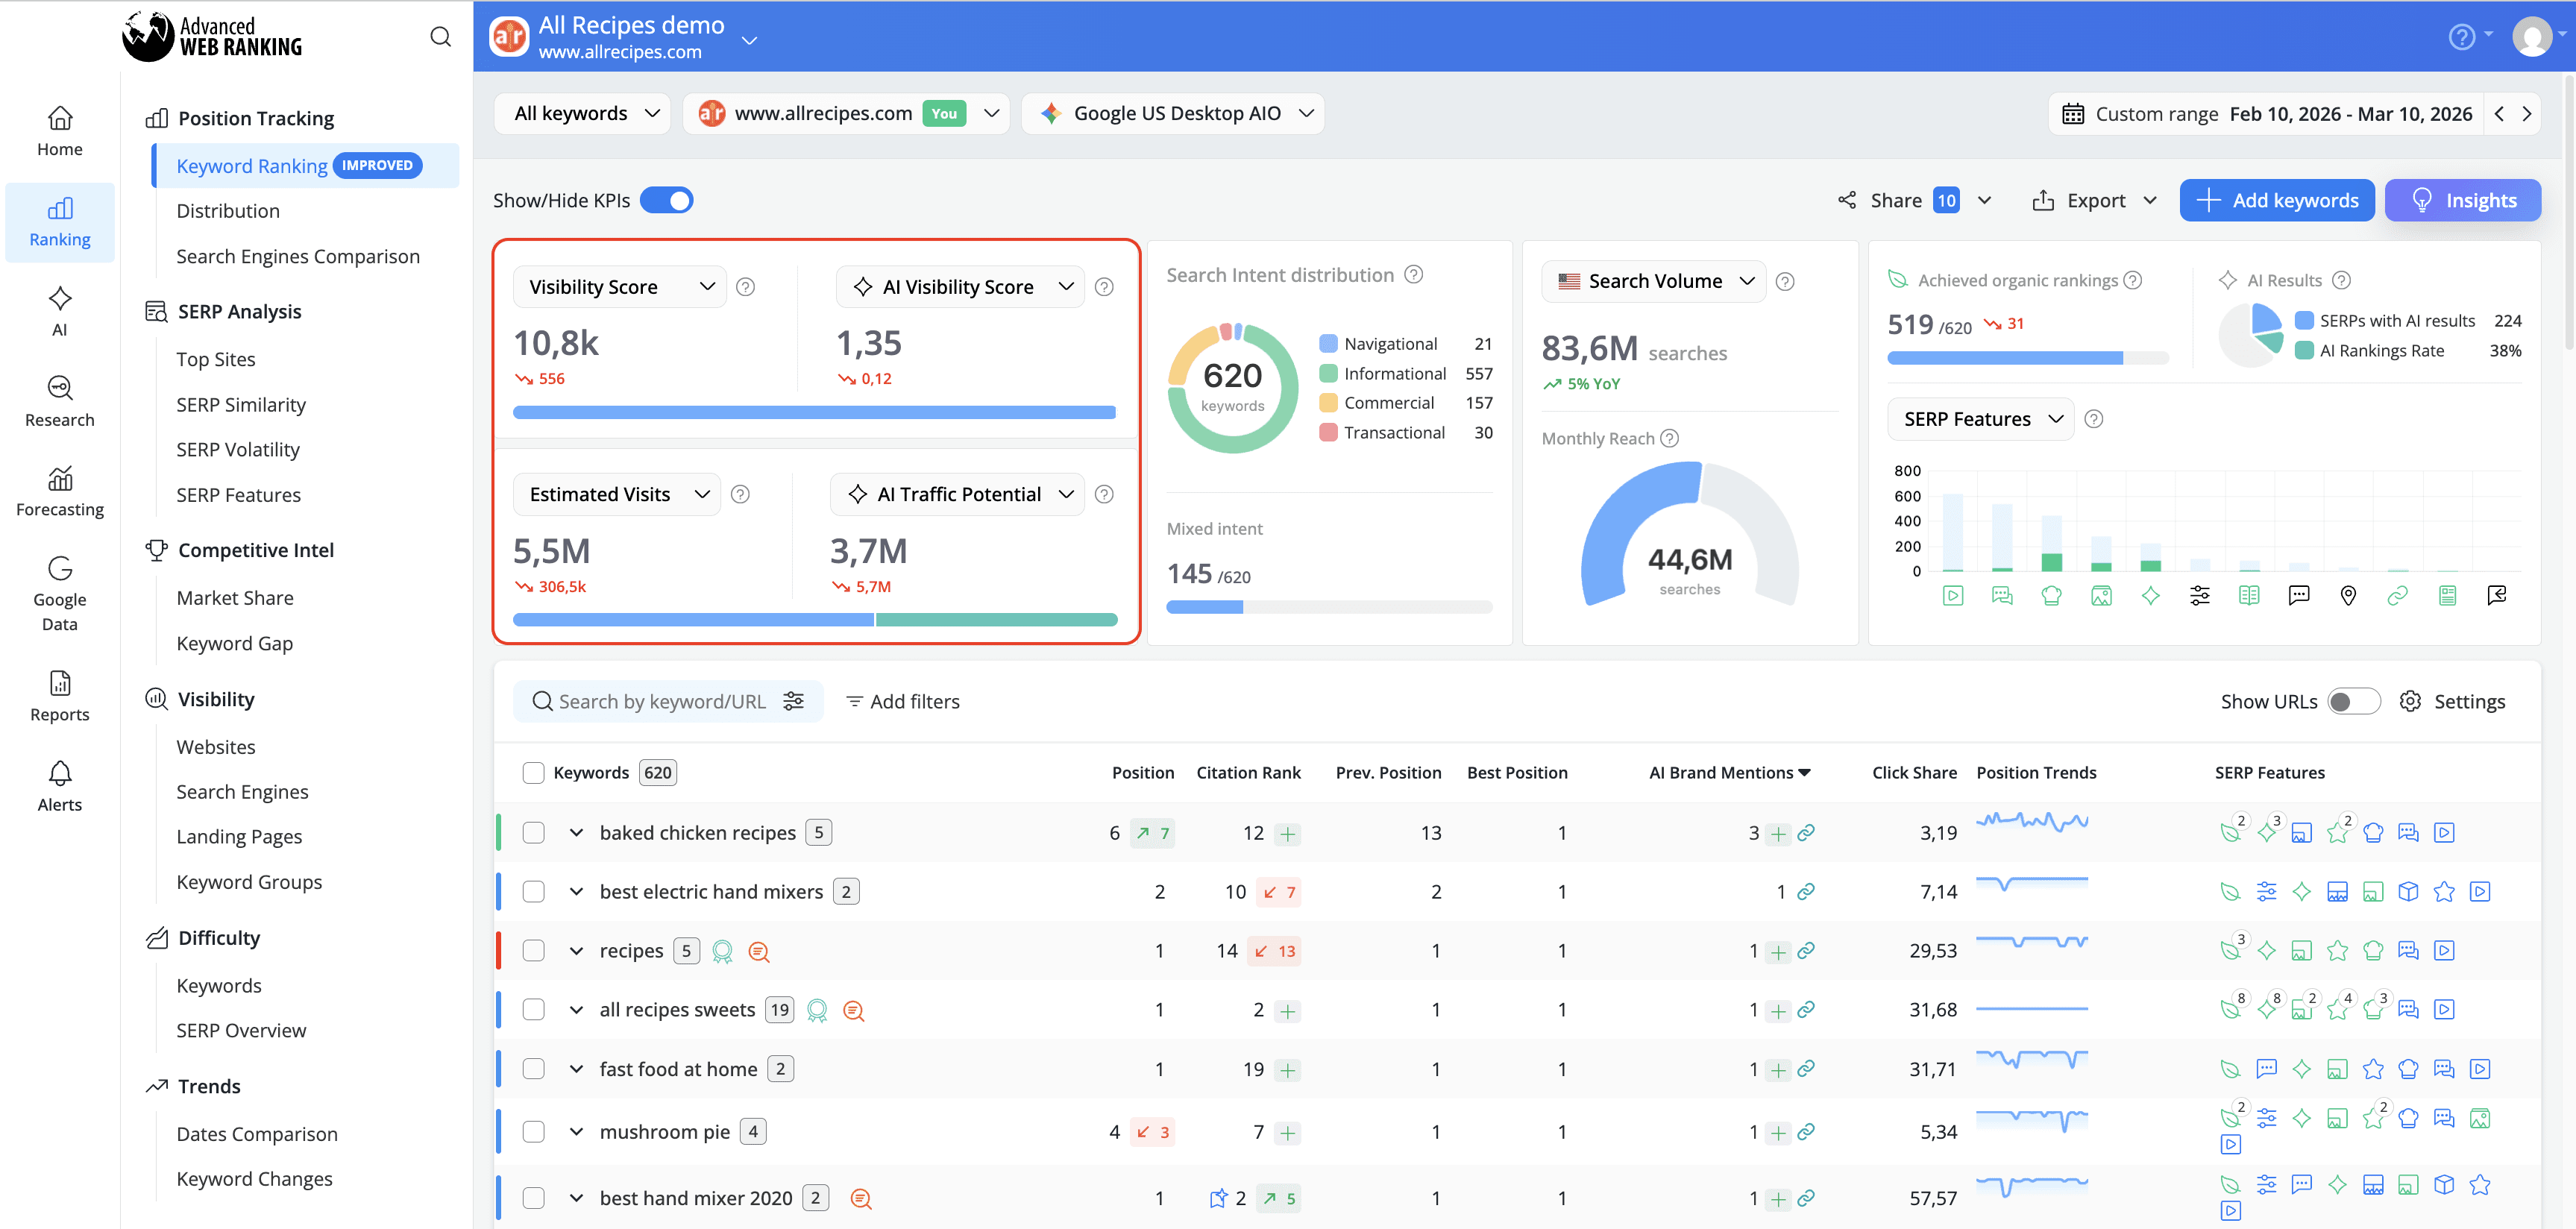
You can now directly compare metrics such as:
Web Visibility % vs. AI Visibility %
Visibility Score vs AI Visibility Score
Estimated Visits vs. AI Traffic Potential
Local Estimated Visits vs. AI Local Traffic Potential
This side-by-side comparison helps you better understand how much visibility and traffic your website receives from traditional search results, as well as how much exposure potential reach you receive from AI-generated answers.
The values shown in the KPI boxes correspond to the last update performed within the selected date range. By clicking on a KPI, you can see an extended chart displaying data from all updates within that date range, allowing you to analyze how the metrics evolved over time.
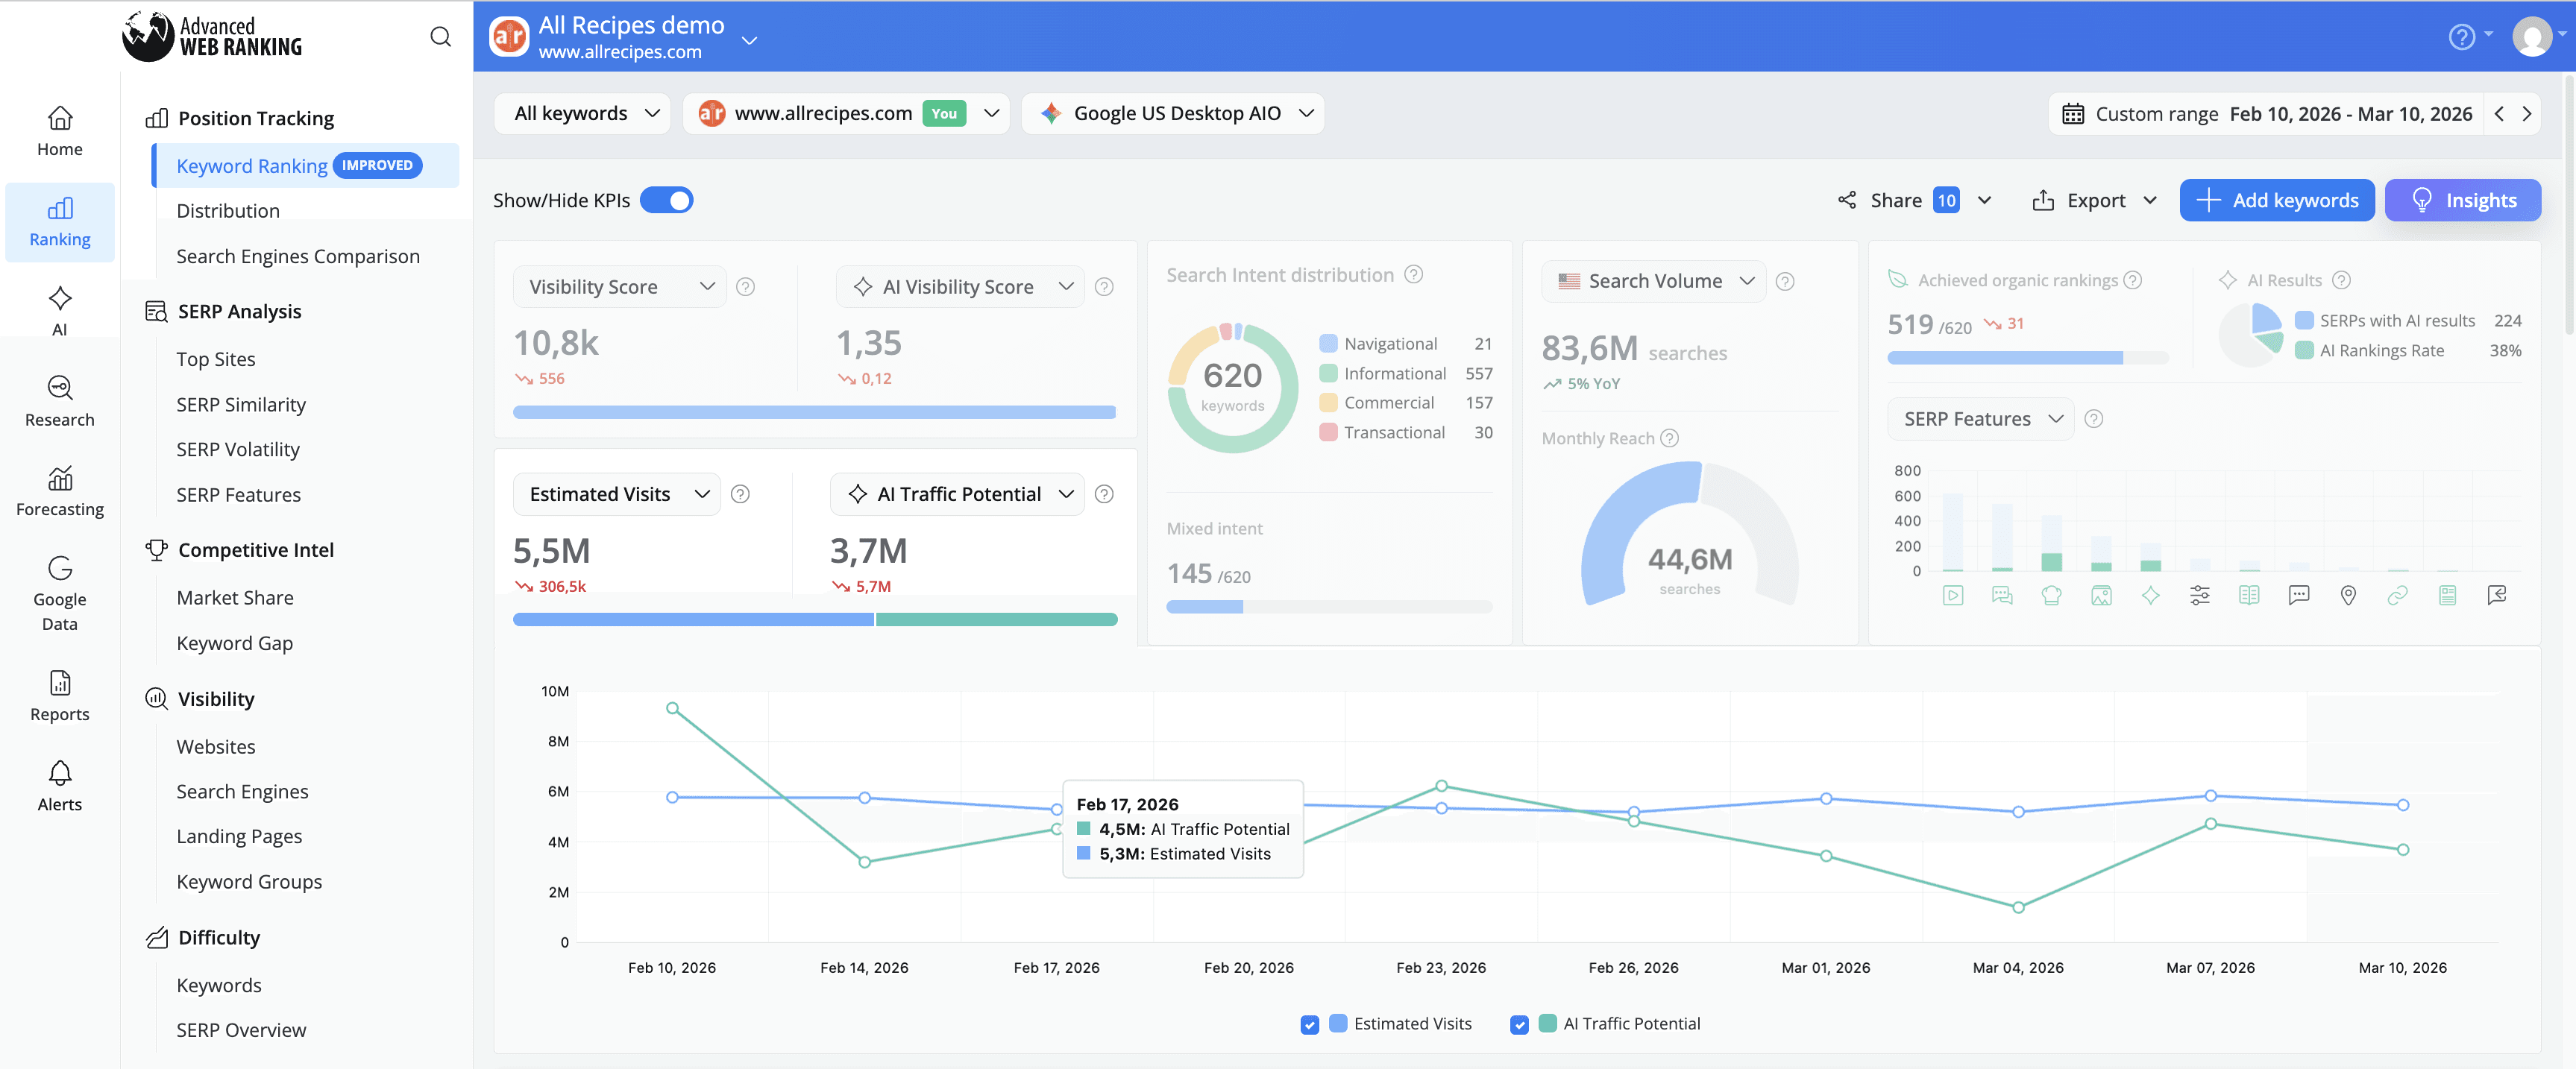
By bringing these metrics together, you can more easily assess your overall search presence, spot gaps between organic rankings and AI exposure, and identify new opportunities to increase your brand’s visibility in both search environments.
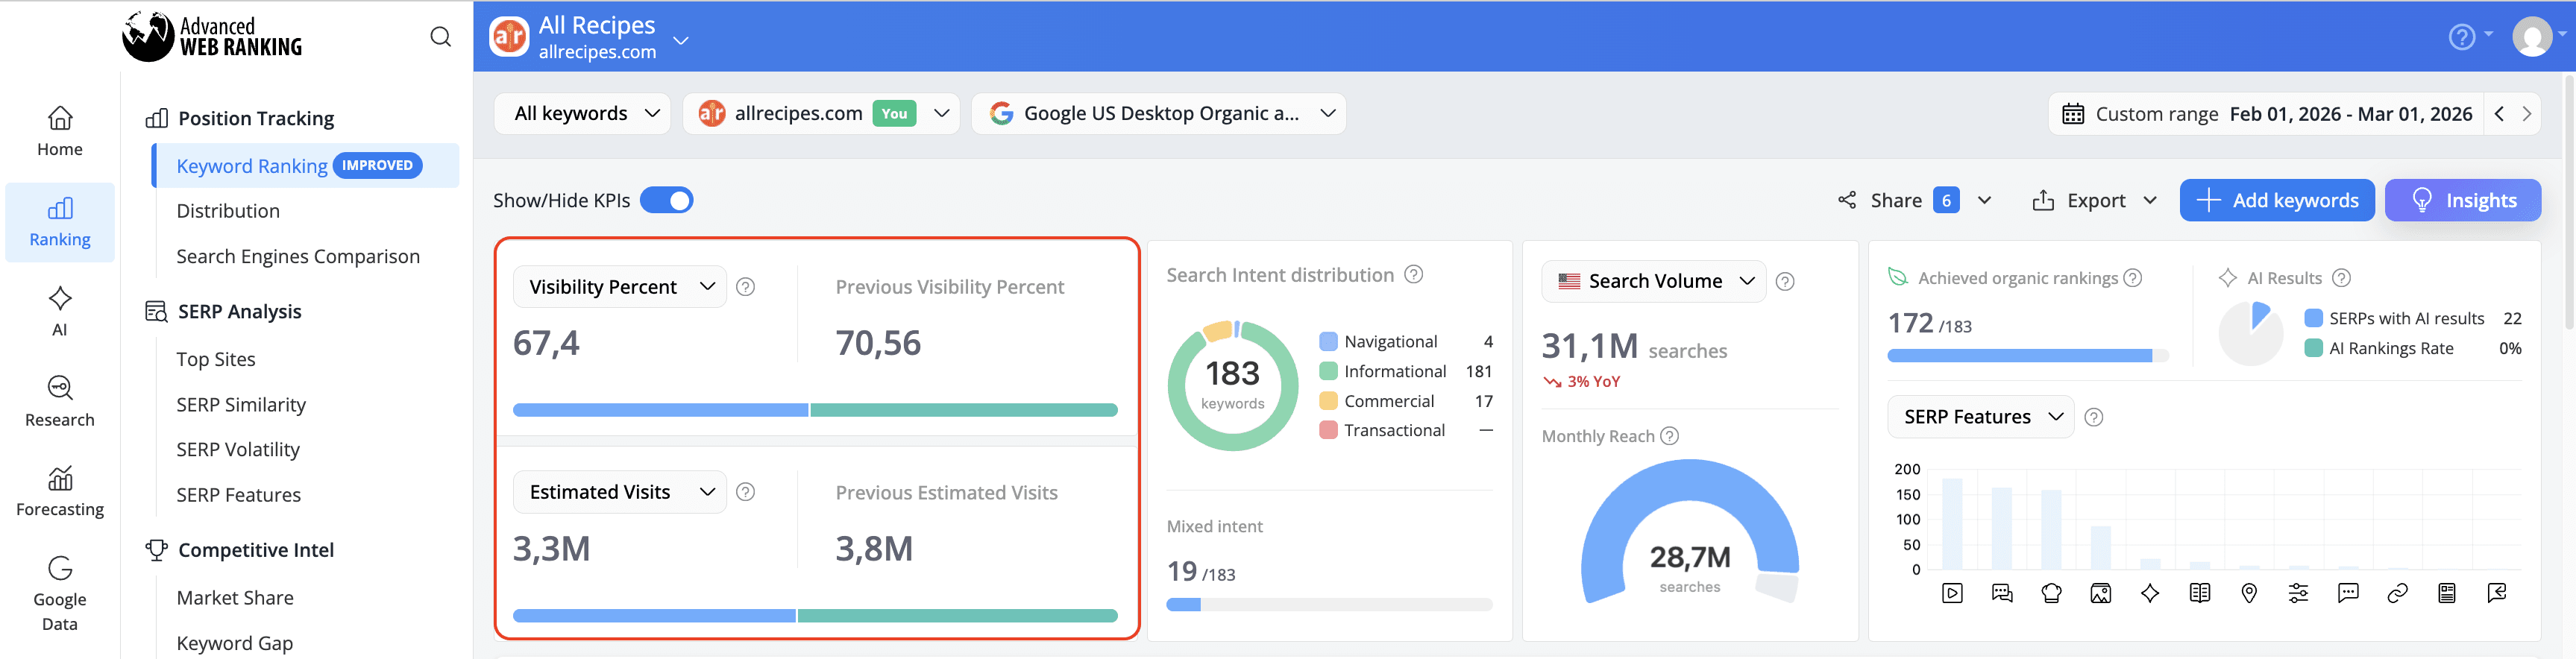
When AI tracking is not available for the search engines added to a project, the AI KPIs are automatically replaced with a comparison with the previous period, ensuring you still get meaningful context about performance changes.
Upgraded Search Volume KPI
The Search Volume KPI has been enhanced to provide a clearer understanding of search demand trends and the true size of the search audience your website can potentially reach.
This update introduces a new metric: Monthly Reach, which estimates the size of the potential search audience your tracked website can reach based on all the keywords for which it is currently ranking. This helps you better understand how much of the available search demand your current rankings are capturing.
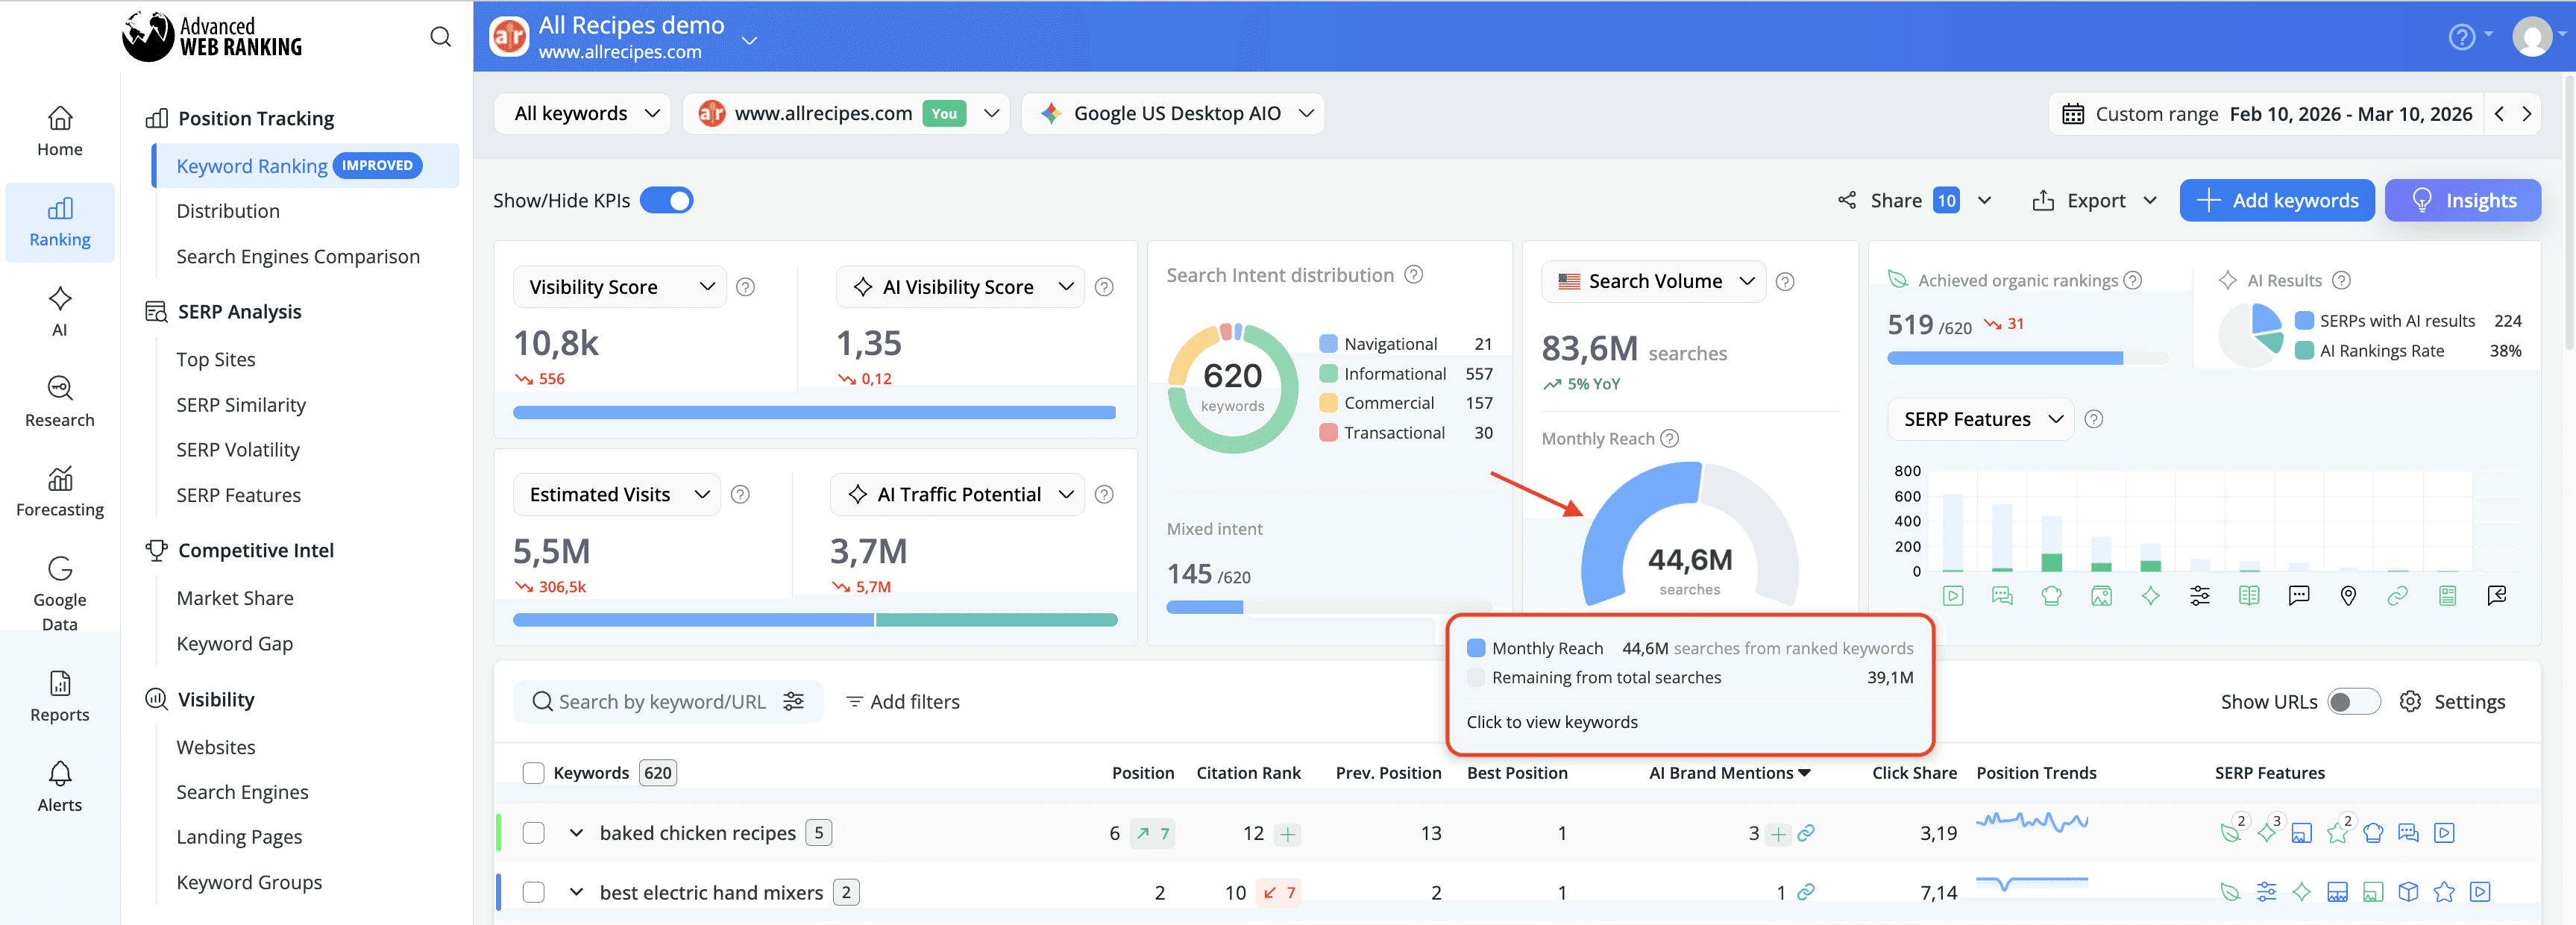
The new KPI highlights:
Monthly Reach – the total number of searches generated by the keywords for which your website currently ranks.
Remaining from total searches – the portion of search demand coming from keywords where your website does not yet rank, highlighting additional growth opportunities.
By clicking on the Monthly Reach KPI, the keyword table will automatically be filtered to display all the keywords for which the tracked website is currently ranking, allowing you to easily identify which keywords contribute to that reach.
The Search Volume KPI now includes an improved extended chart that includes a Year-over-Year comparison for the last 12 months, helping you quickly identify long-term search demand trends.
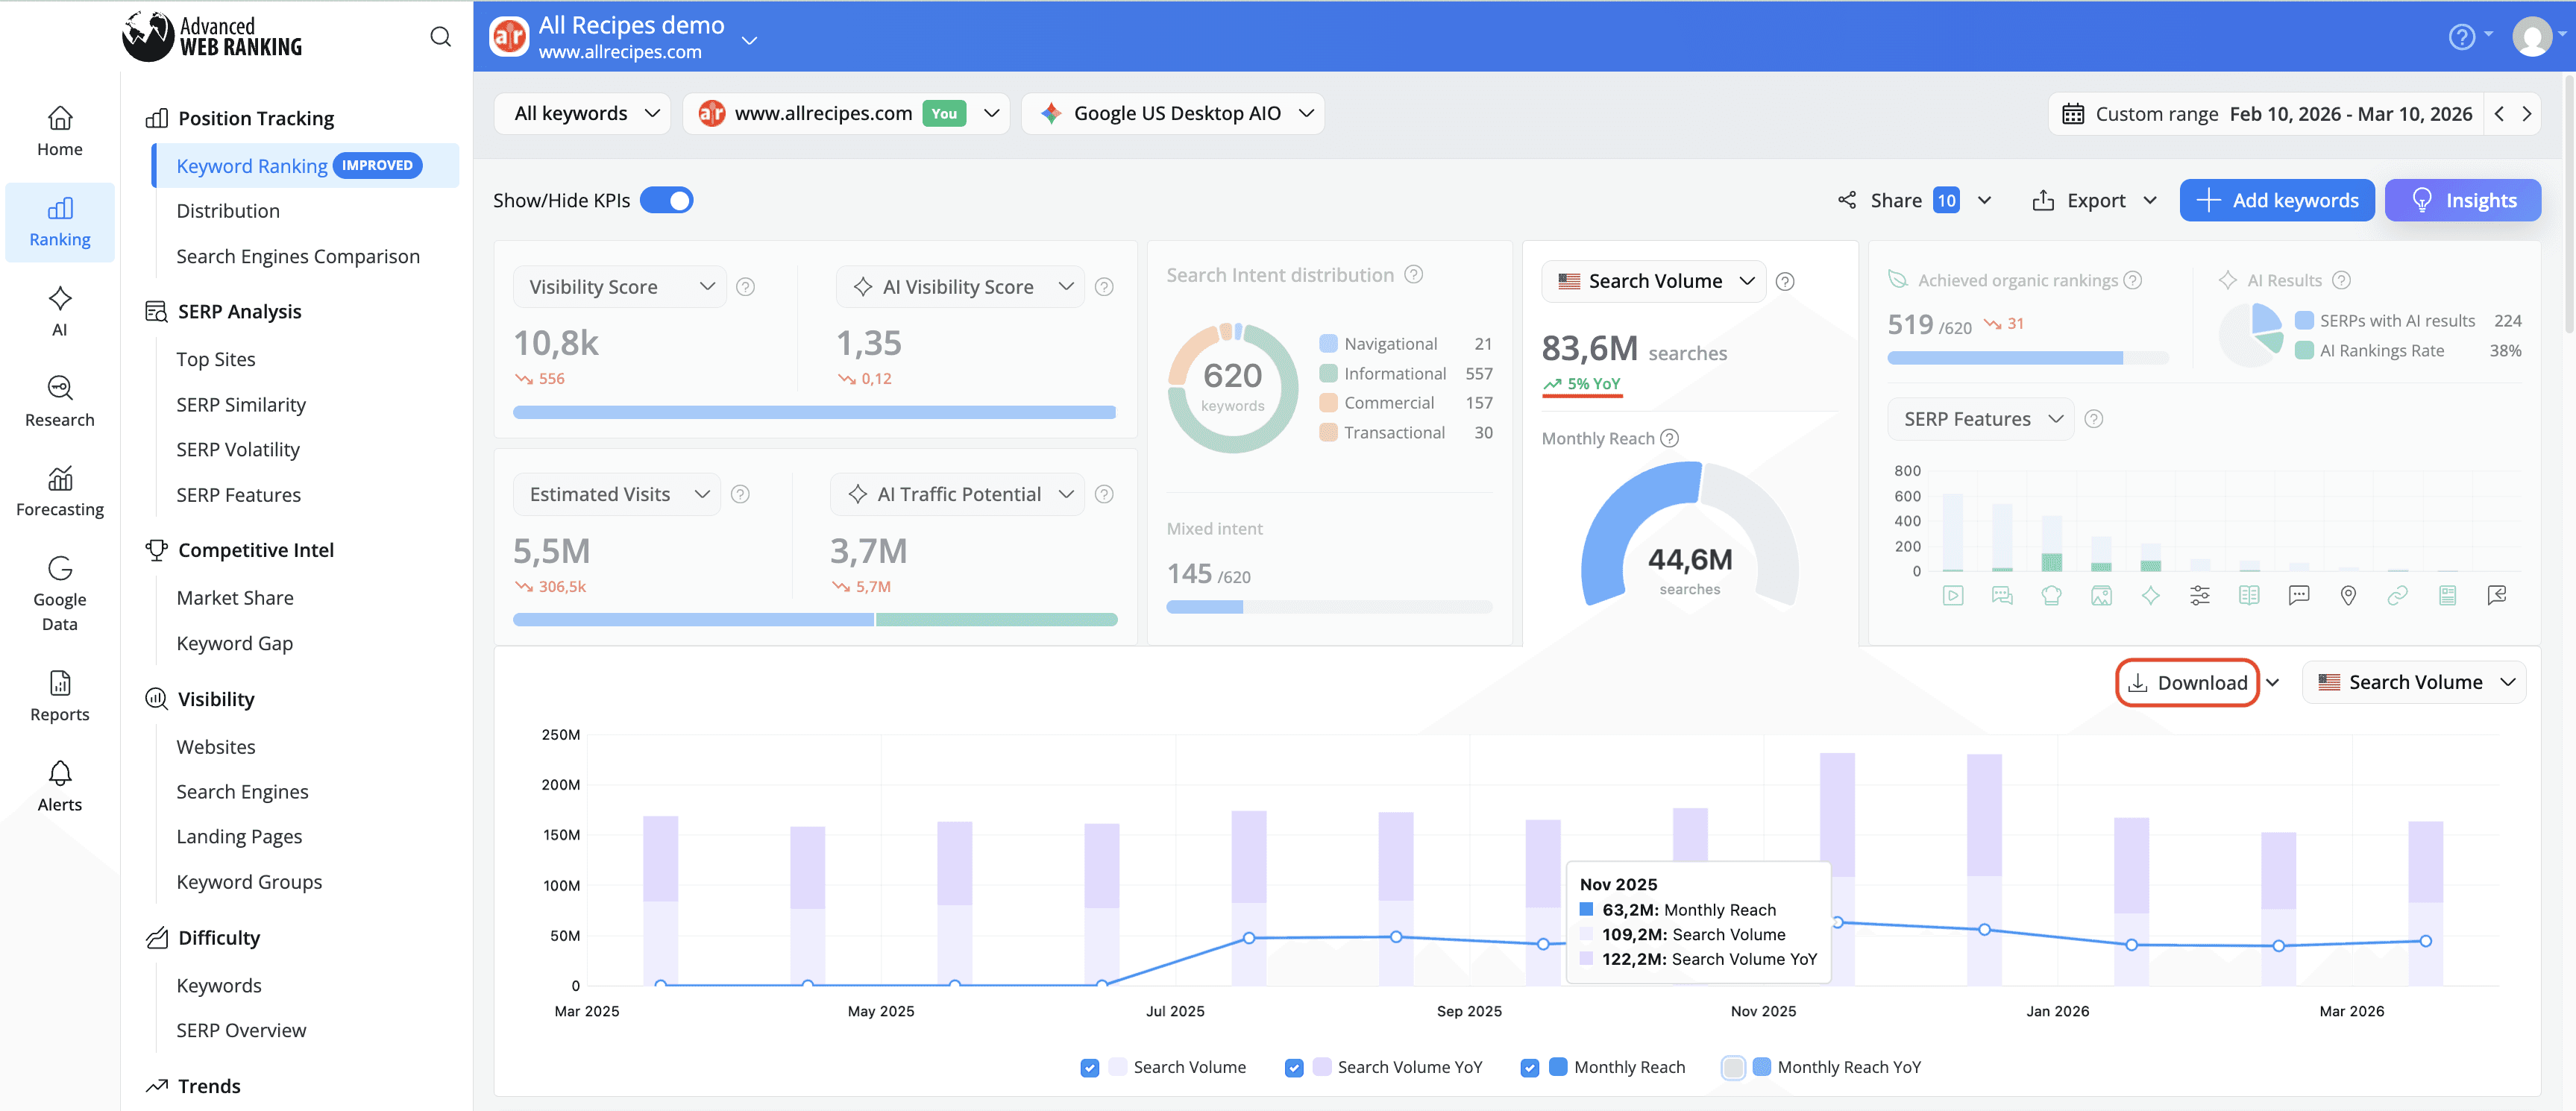
To make changes easier to interpret, the YoY comparison is now displayed as a percentage instead of an exact value.
Additionally, you can now download Search Volume data together with their YoY summaries in CSV or XLSX format ,making it easier to include this data in reports, presentations, or further analysis.
Enhanced SERP Features & AI Visibility Insights
The SERP Features & AI Presence KPI has been expanded with new and improved KPIs designed to help you better understand how your website appears in both traditional SERP features and AI-generated results:

Achieved Organic Rankings
Shows the total number of tracked keywords for which your website ranks with an organic result in the SERP. This helps you quickly assess how many of your tracked keywords currently contribute to your organic search visibility.
SERPs with AI Results
Shows the number of tracked keywords for which an AI-generated response appears in the search results, such as a Google AI Overview or an AI answer from supported LLM engines. This helps you identify how often AI results are present across your monitored keywords.
AI Rankings Rate
The percentage of tracked keywords for which your domain appears within an AI-generated result, either as a cited source or via a brand mention relative to all keywords that generate an AI response.
Expanded SERP Features chart
You can now compare organic rankings against AI Overview results in an extended chart, so you can quickly see whether your keywords ranking organically also appear in AI-generated results.

The chart reveals:
How many tracked keywords rank organically
How many tracked keywords rank both organically and in AI Overviews
How many tracked keywords trigger an AI Overview result
This makes it easy to identify missed AI opportunities, uncover gaps in your visibility, and prioritize optimization efforts.
Beyond AI Overviews, you can now overlay organic performance against any SERP feature tracked in your project, including Featured Snippets, Image Packs, Local Packs, Video Results, and more. This allows you to see not only how often a feature appears on the SERPs, but also how often your website actually achieves it.

By analyzing these numbers, you can identify untapped opportunities, prioritize which SERP features to target, and make data-driven decisions to boost your website’s visibility and traffic.
Click Share KPIs – Side-by-Side Comparison with Previous Values
The Click Share and Total Click Share KPIs for the latest update are now displayed side by side with the previous values from the start of your selected date range. Previously, the metrics were shown together with the numeric change, but this new layout makes it easier to see both the current and previous values at a glance.
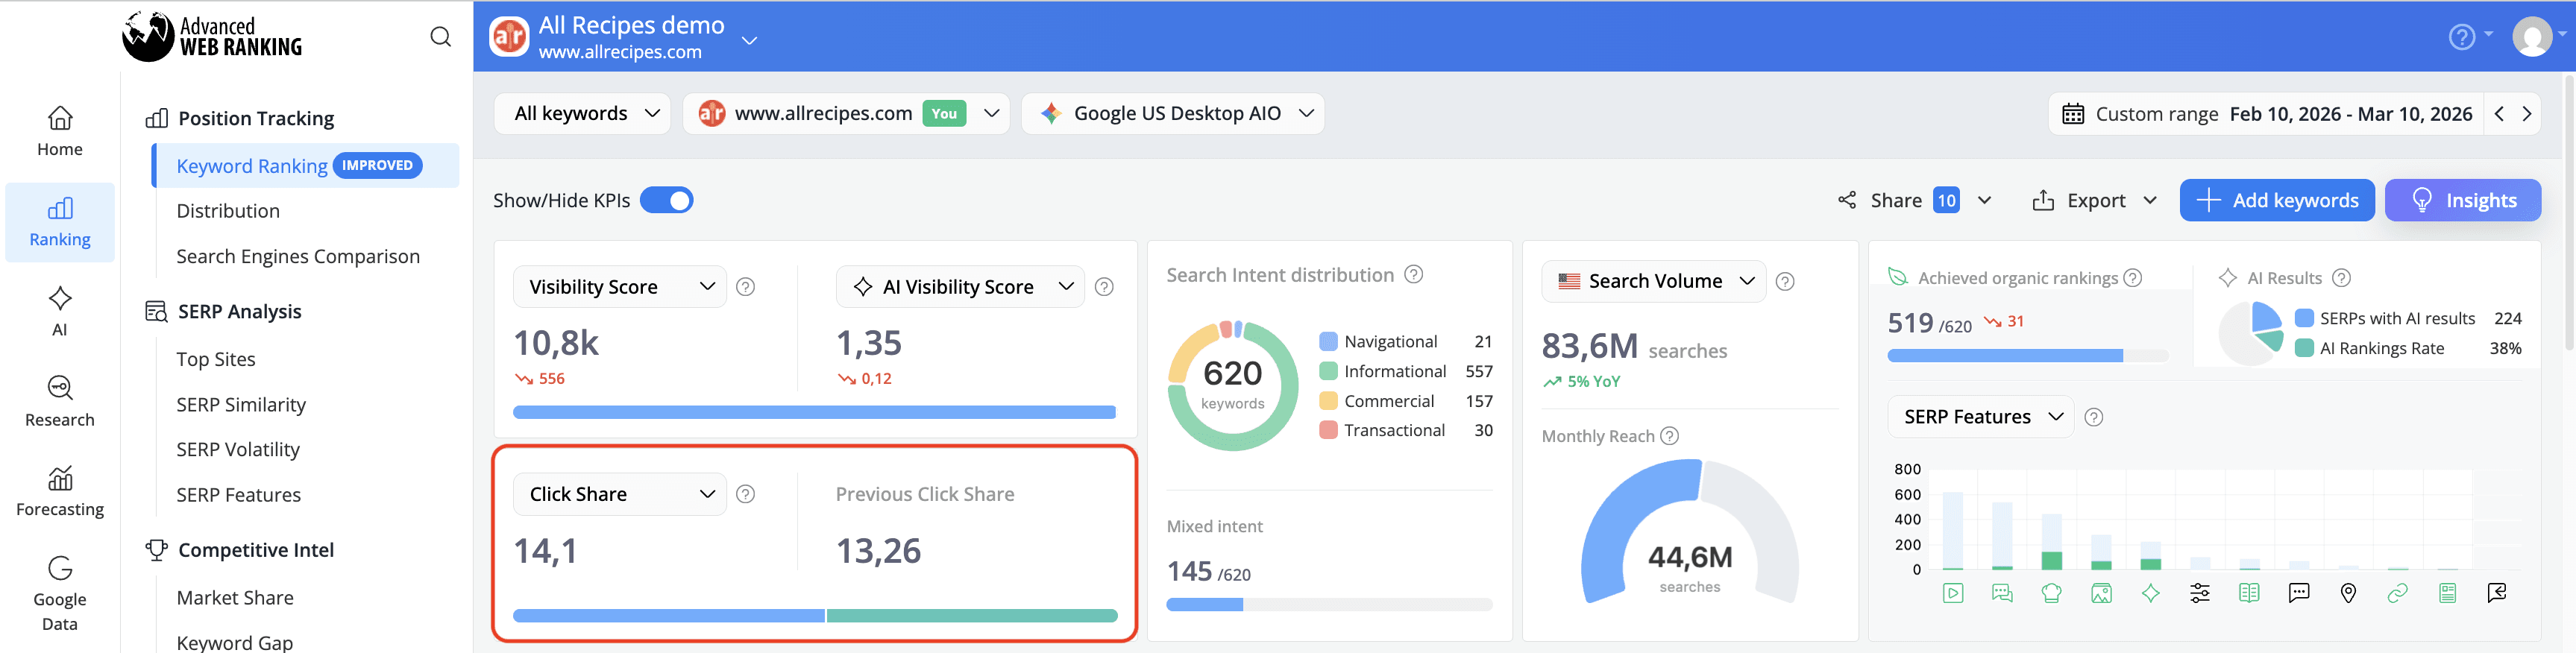
This comparison allows you to see how the most recent update stacks up against the update at the start of the date range, giving clearer context for your website’s performance over time.
These updates make it easier than ever to gain a complete view of your website’s performance, track both organic and AI visibility, analyze Click Share and SERP features, and identify actionable opportunities to improve your website’s visibility in search results.
Do you have any further questions or need more information about this product update? Don't hesitate to get in touch with our dedicated support team.
stay in the loop