
Advice and answers from the Advanced Web Ranking Team
Search for articles
>
>
Achieve Complete SEO Reporting with Visibility Score, Click Share and Market Share
Get a clear view of what Visibility Score, Click Share, and Market Share actually mean, how they’re calculated and how to use them effectively in your SEO reports.

While Visibility Score, Click Share, and Market Share are often grouped together because they all relate to “visibility,” in practice, they measure very different things.
Each one answers a specific question:
Visibility Score reflects your ranking strength
Click Share indicates the traffic you can capture
Market Share compares your performance against competitors
Using each metric in the right context helps you build more accurate and meaningful SEO reports.
TL;DR: Rankings, Traffic & Competitor Analysis in One View
Visibility Score, Click Share and Market Share each highlight a different part of your SEO performance and together they give you a complete picture.
Visibility Score shows how well you rank in search results, focusing only on your positions. Click Share turns those rankings into estimated traffic, helping you understand how much traffic your rankings are likely to bring. Market Share puts everything in context by showing how you compare to your competitors in terms of overall visibility.
When you look at them together, you can clearly see how strong your rankings are, what they’re worth in traffic and where you stand in your market.
Visibility Score
Visibility Score reflects how strong your positions are across your tracked keywords.
It is based entirely on where you appear in search results, without considering how often those keywords are searched or how much traffic they might generate.
How is it calculated?
Visibility Score is based on where your website appears in search results across your tracked keywords and search engines.
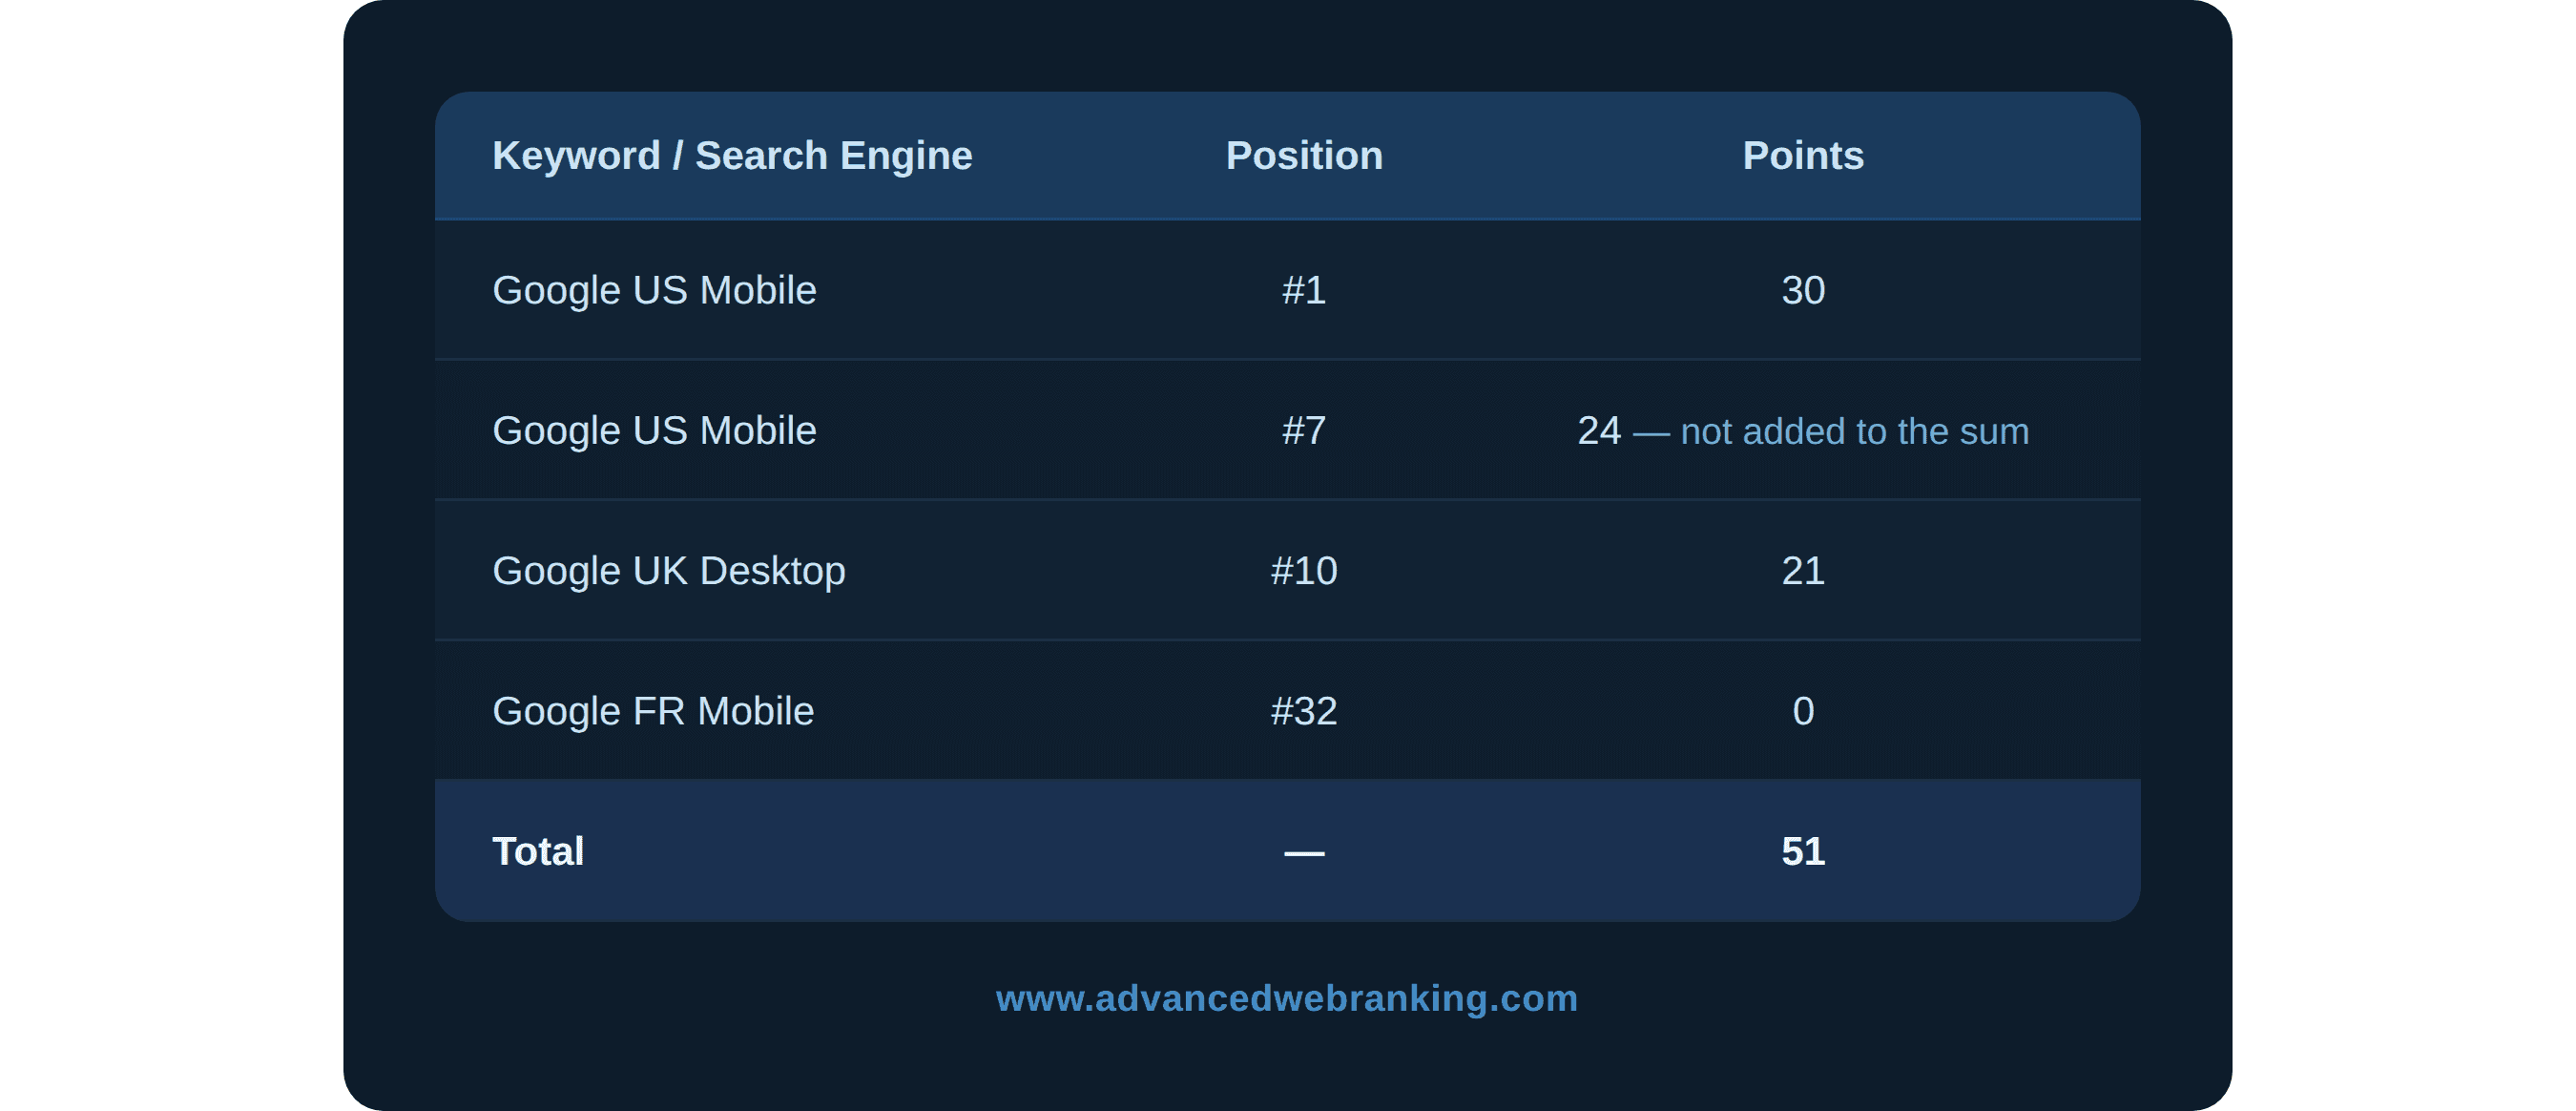
Each position in the top 30 results is given a number of points: the higher you rank, the more points you earn. As you move down the results, the points gradually decrease and anything beyond position 30 doesn’t count.
Here’s how the points are assigned:
Position 1 = 30 points
Position 2 = 29 points
…
Position 30 = 1 point
Positions below 30 = 0 points
All the points from your rankings are then added together to form the total Visibility Score. For each keyword, only the highest-ranking URL contributes to the score.
Example
Visibility Score can be calculated either for all the keywords in your project or for specific keyword groups, depending on how you want to analyze performance.
You can see the positions of the highest-ranking URLs for your keywords, used to calculate the score, in the Keyword Ranking report:
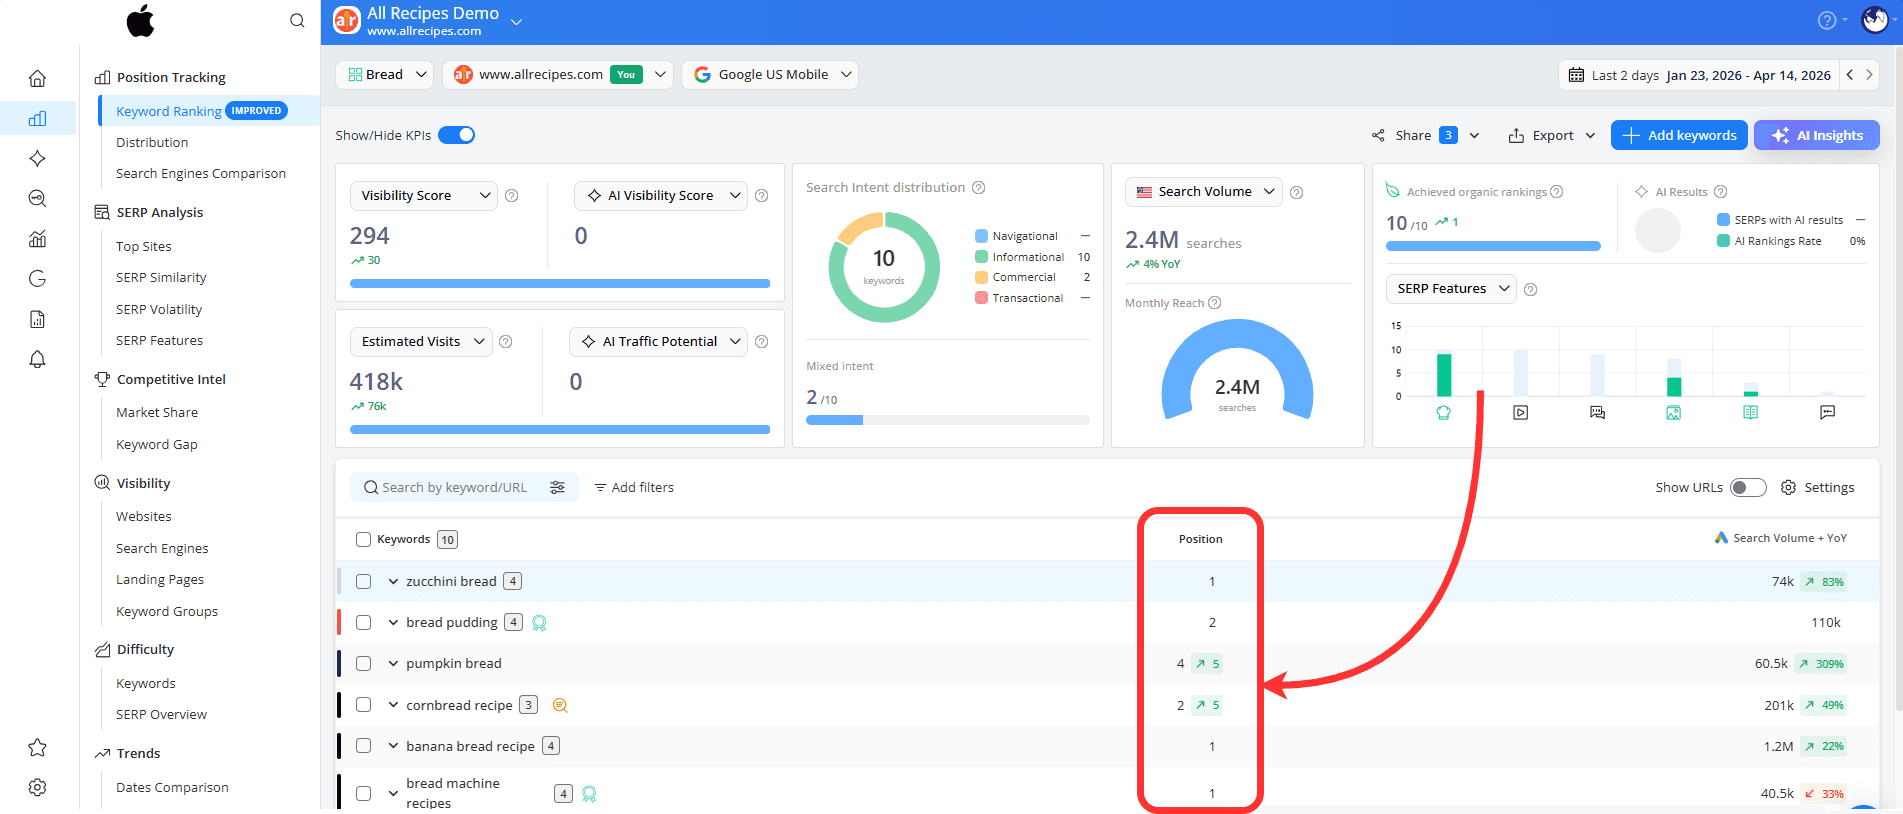
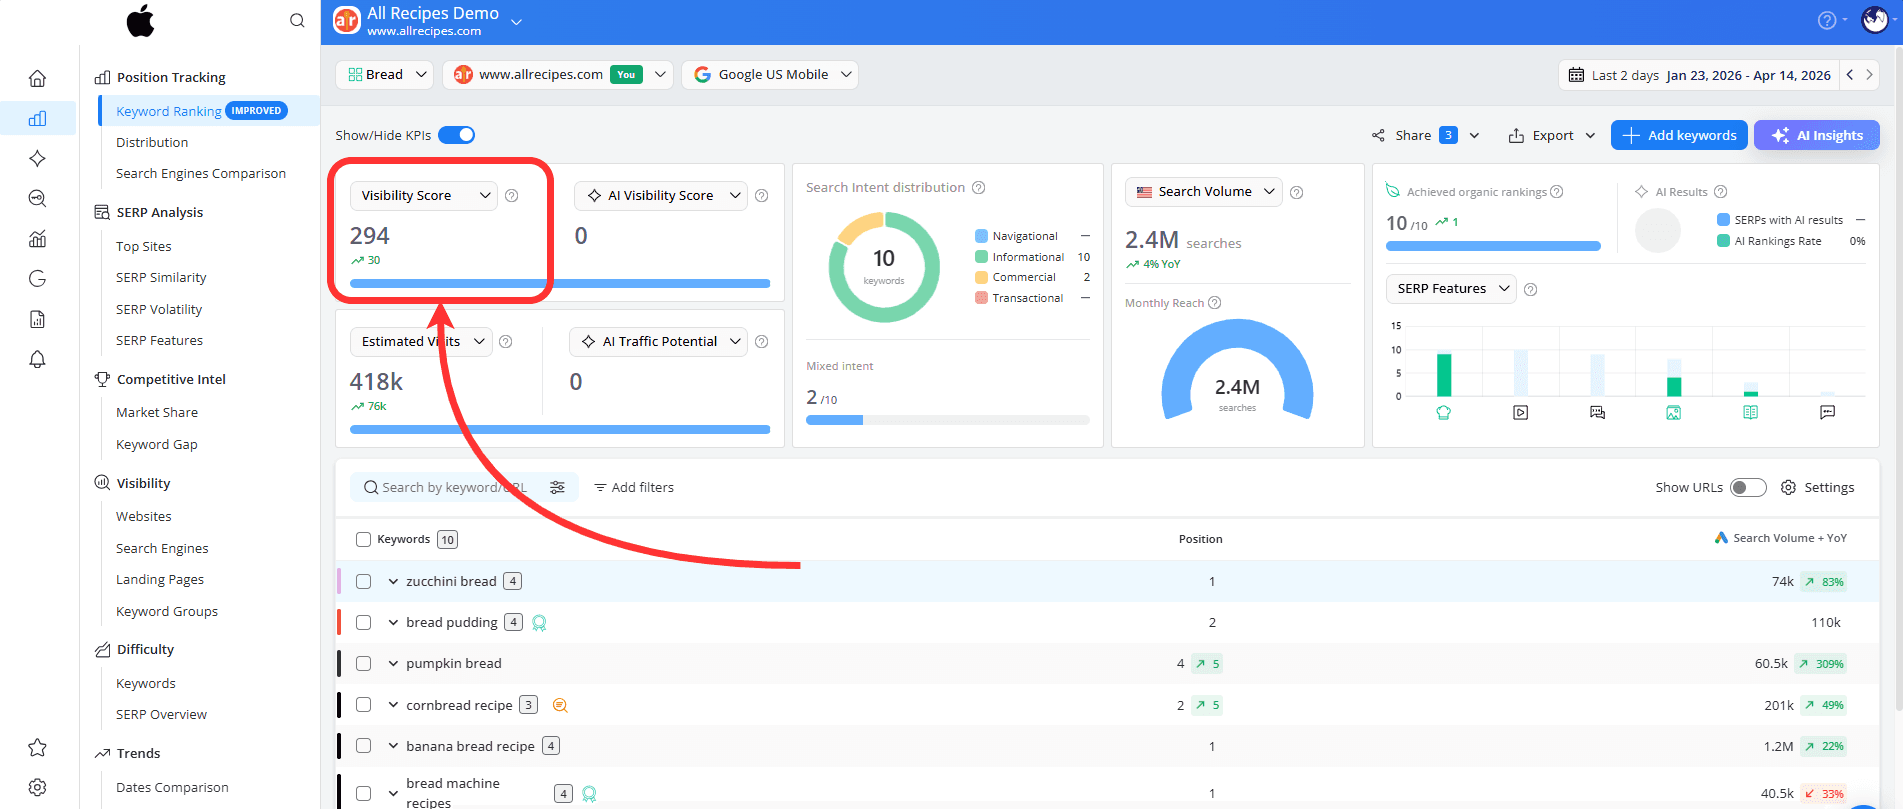
Based on these positions and their assigned scores, you can see the total Visibility Score displayed in the top-left corner of the report.
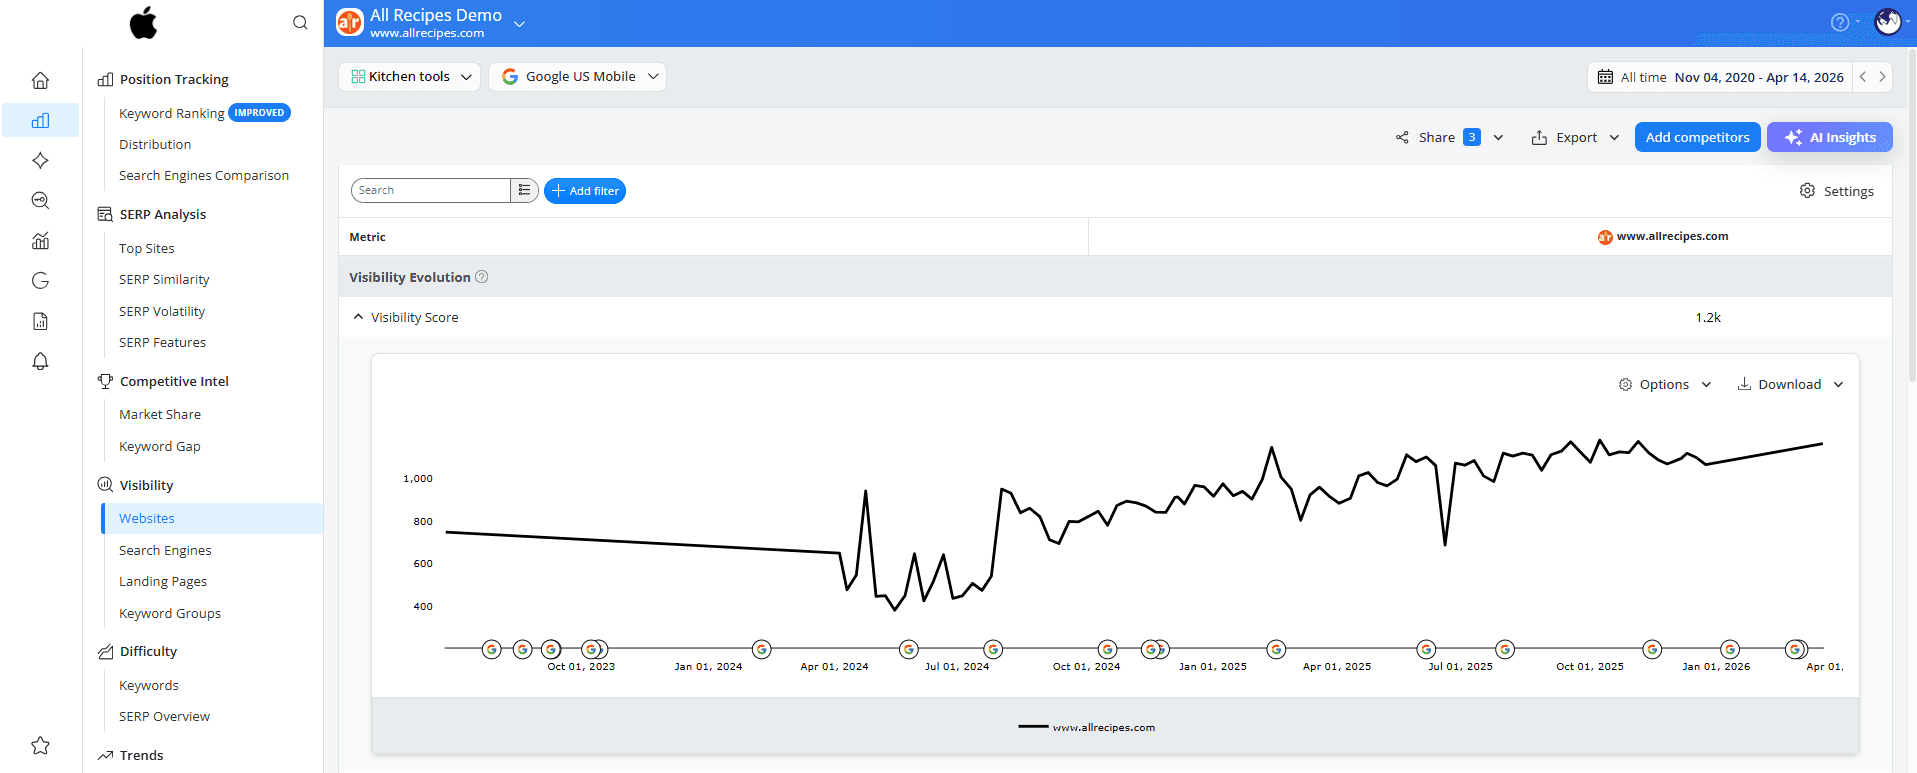
..or, in the Visibility > Websites report, where you can follow how your visibility changes over time in a chart and get a better sense of your overall performance.
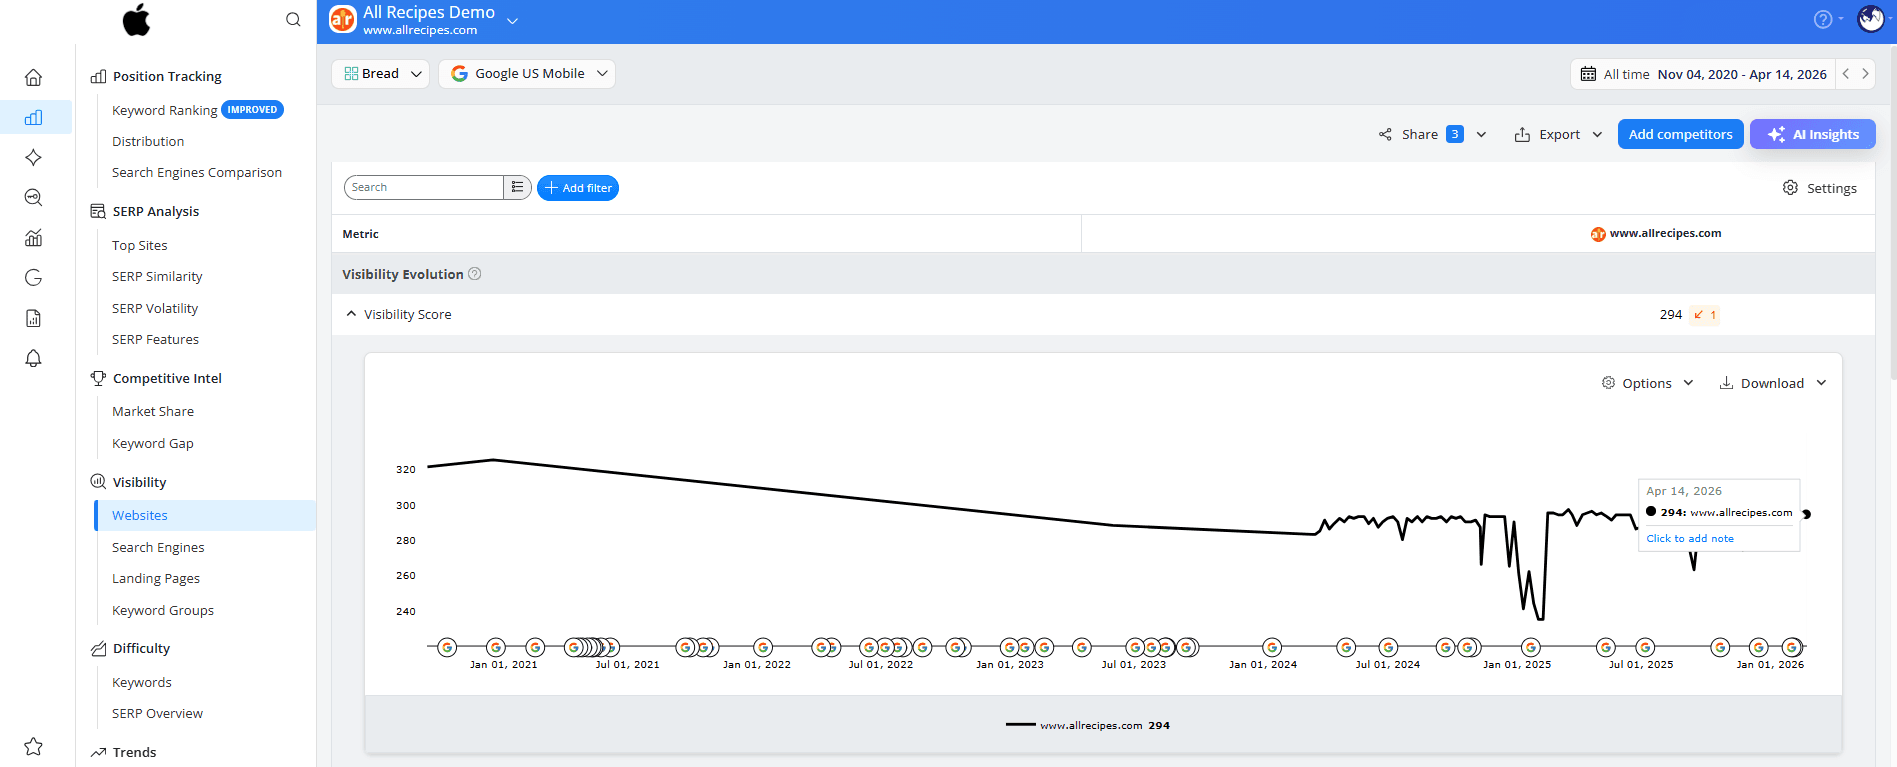
When to use it: Visibility Score is useful when you want to track how your rankings change over time, understand the impact of your SEO efforts, and get a clear overview of how your keywords perform in search results.
Why it’s helpful: This metric reflects ranking performance only. A higher score means stronger positions, but it doesn’t necessarily translate into more traffic.
Click Share
Click Share estimates how many visits your website is likely to get based on your rankings. It combines your positions in search results with how often people search for those topics and how likely they are to click on your pages.
It turns rankings into something more practical by showing how users engage with search results.
How is it calculated?
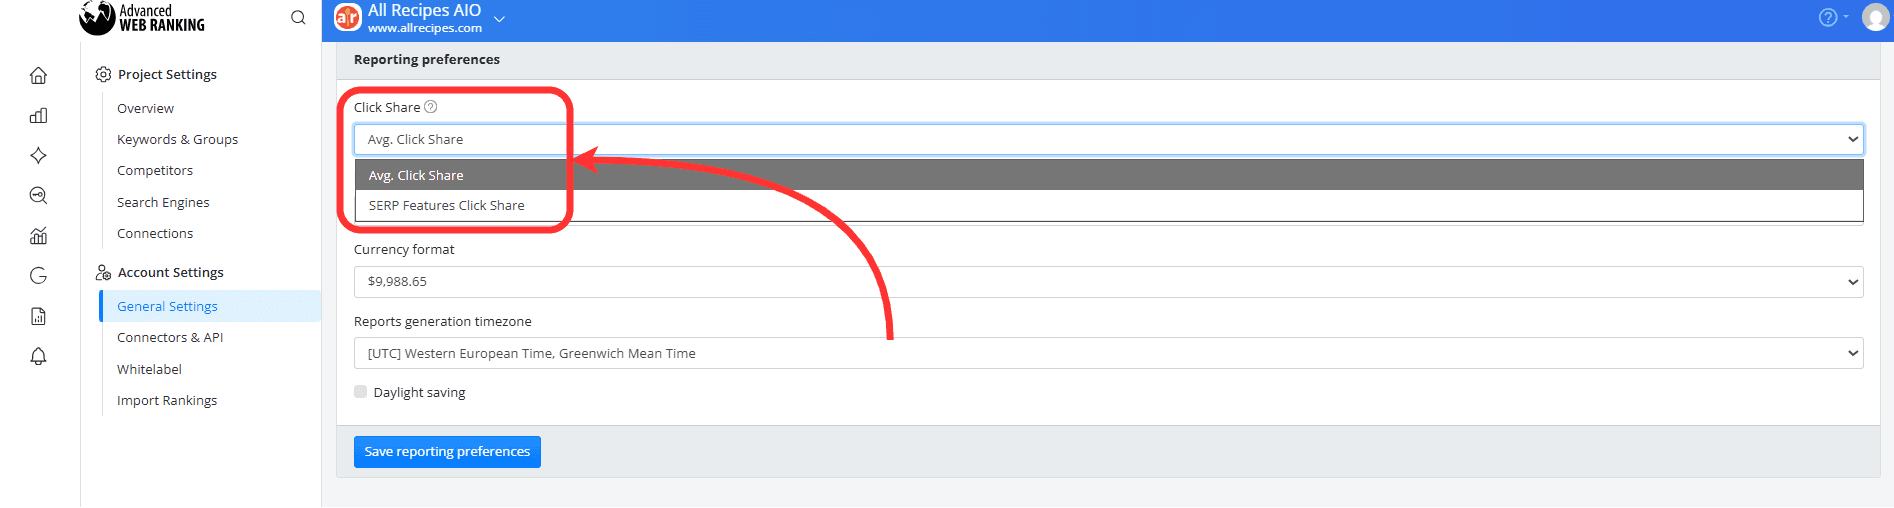
Depending on the Click Share preference selected in the General Settings > Reporting Preferences section, the score can be calculated either as an average for the top 20 URLs or adjusted based on how SERP features appear on Google.
This metric is available at keyword level in the Keyword Ranking report by adding the Click Share column from Table Settings:

…or as an aggregated value for all keywords in your project, shown in the top-left corner of the report:
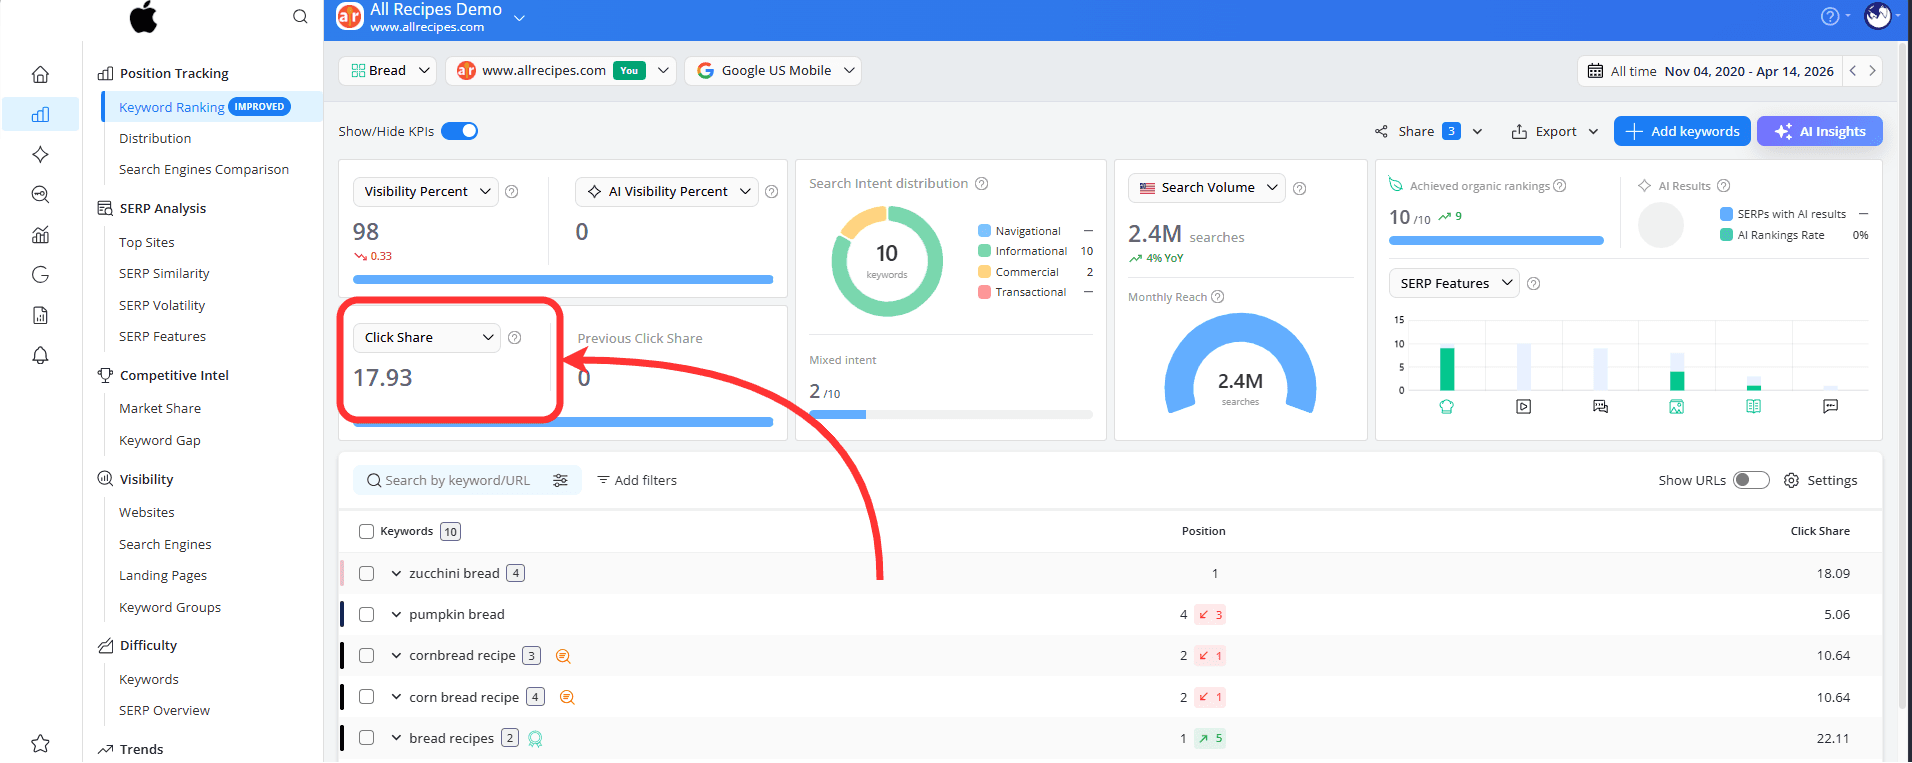
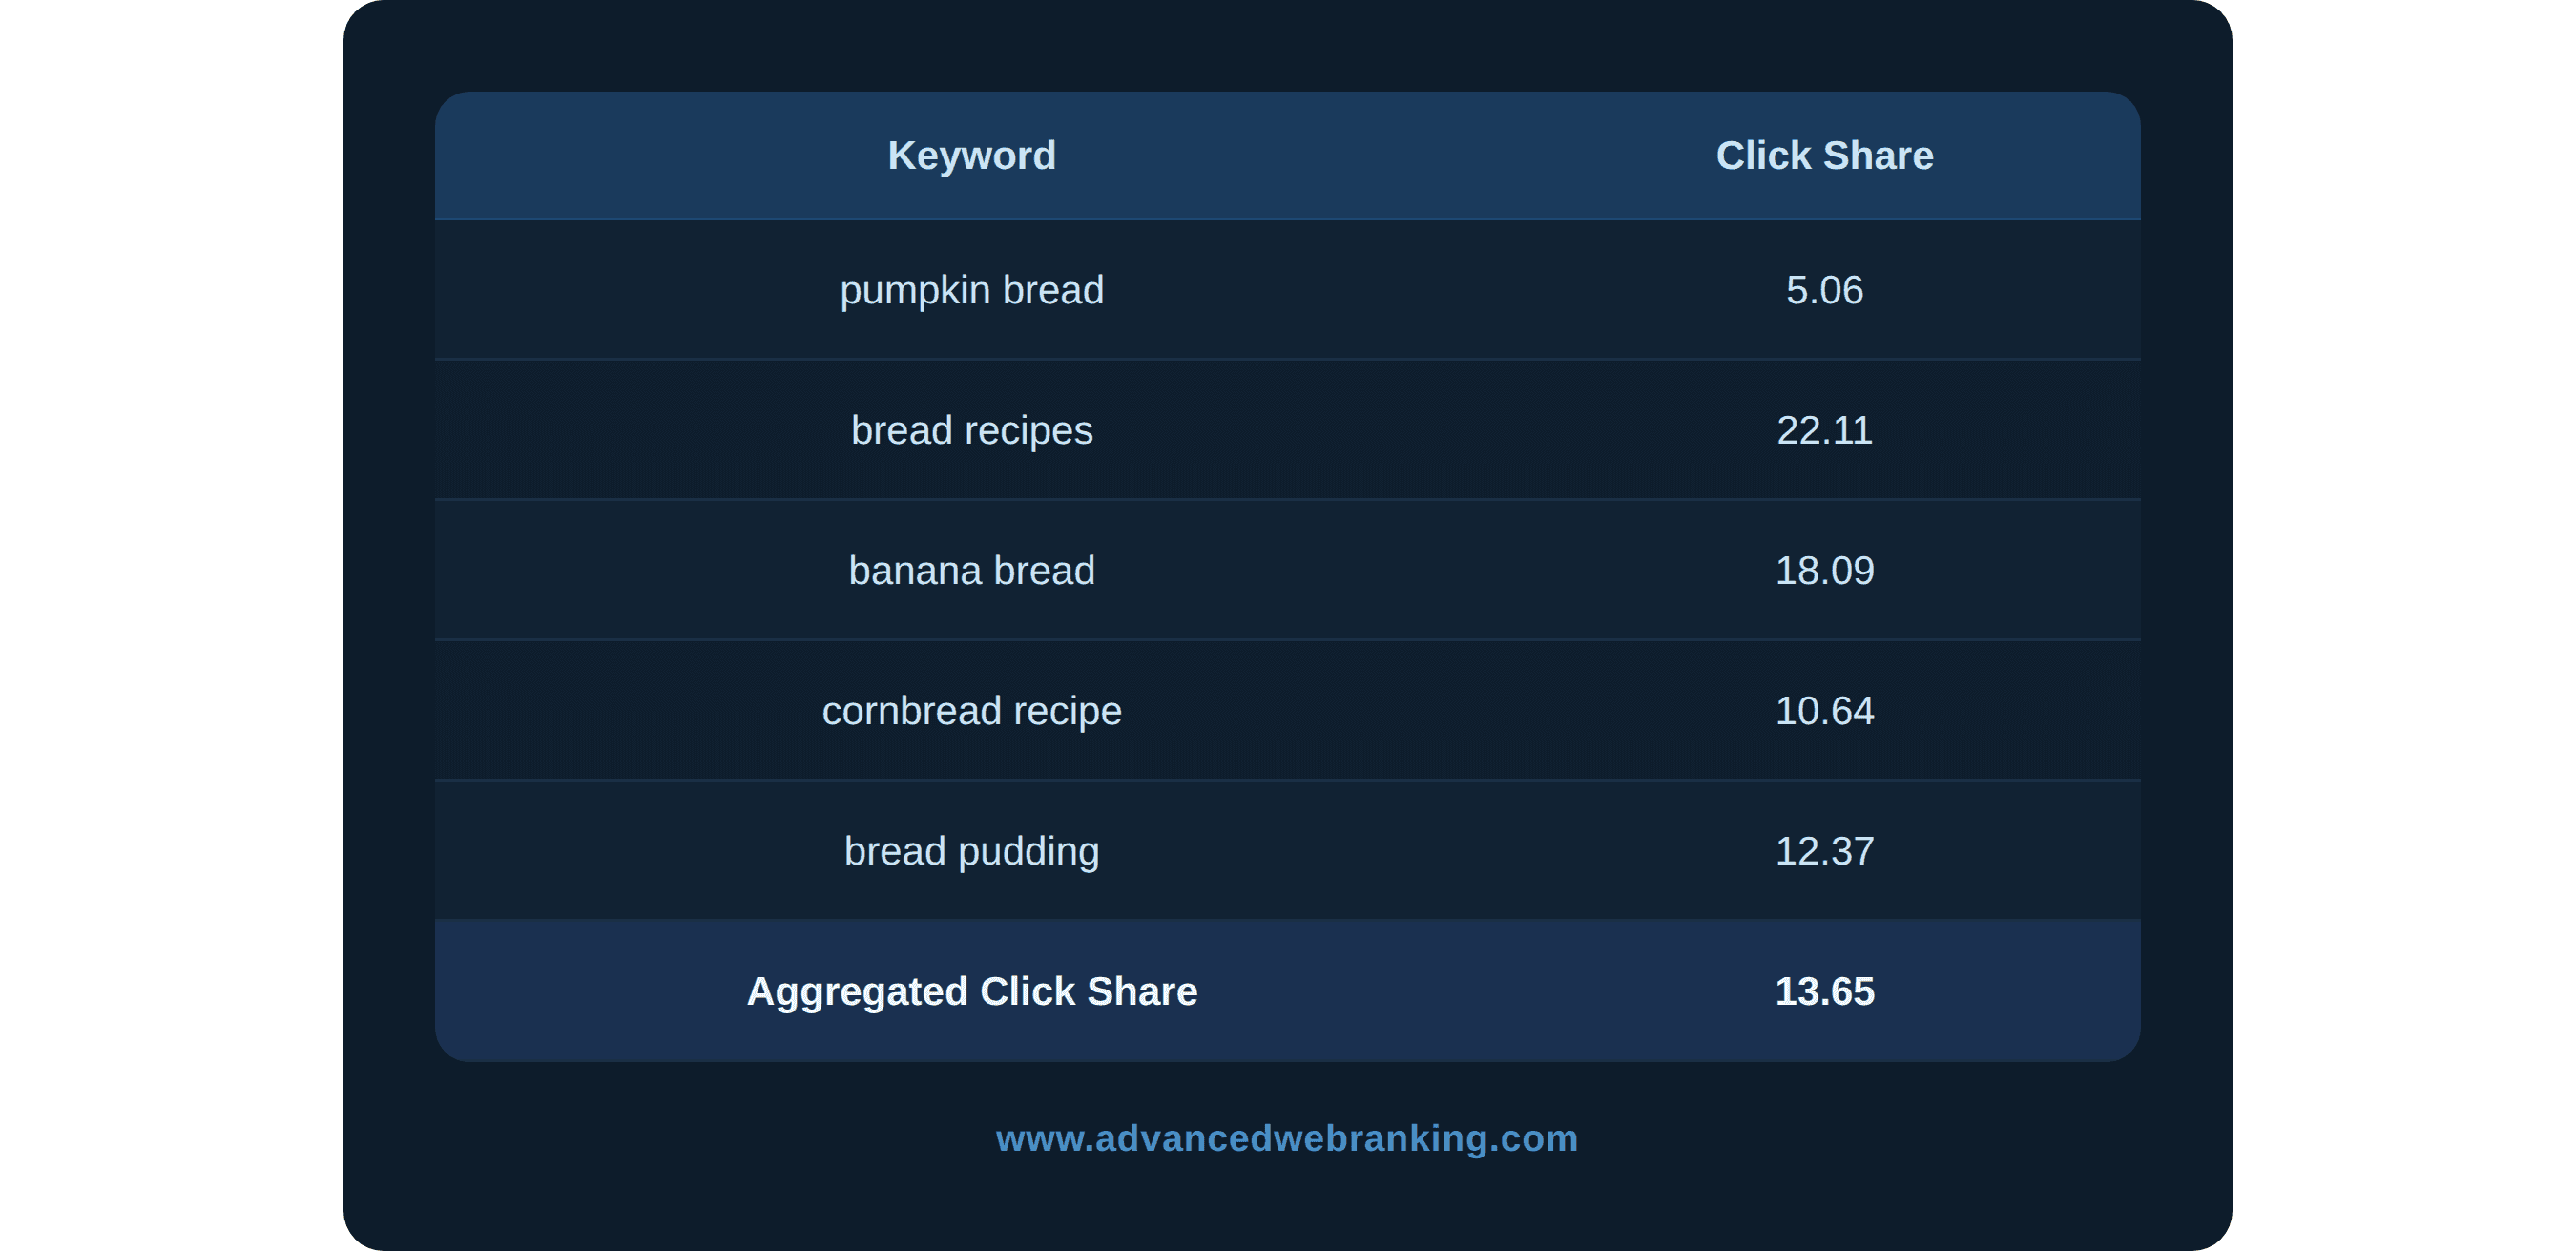
This value is calculated as the average of the Click Share values for all tracked keywords in your project.
Example
You can also view the SERP Features Click Share Trend for each keyword by hovering over the Click Share value:
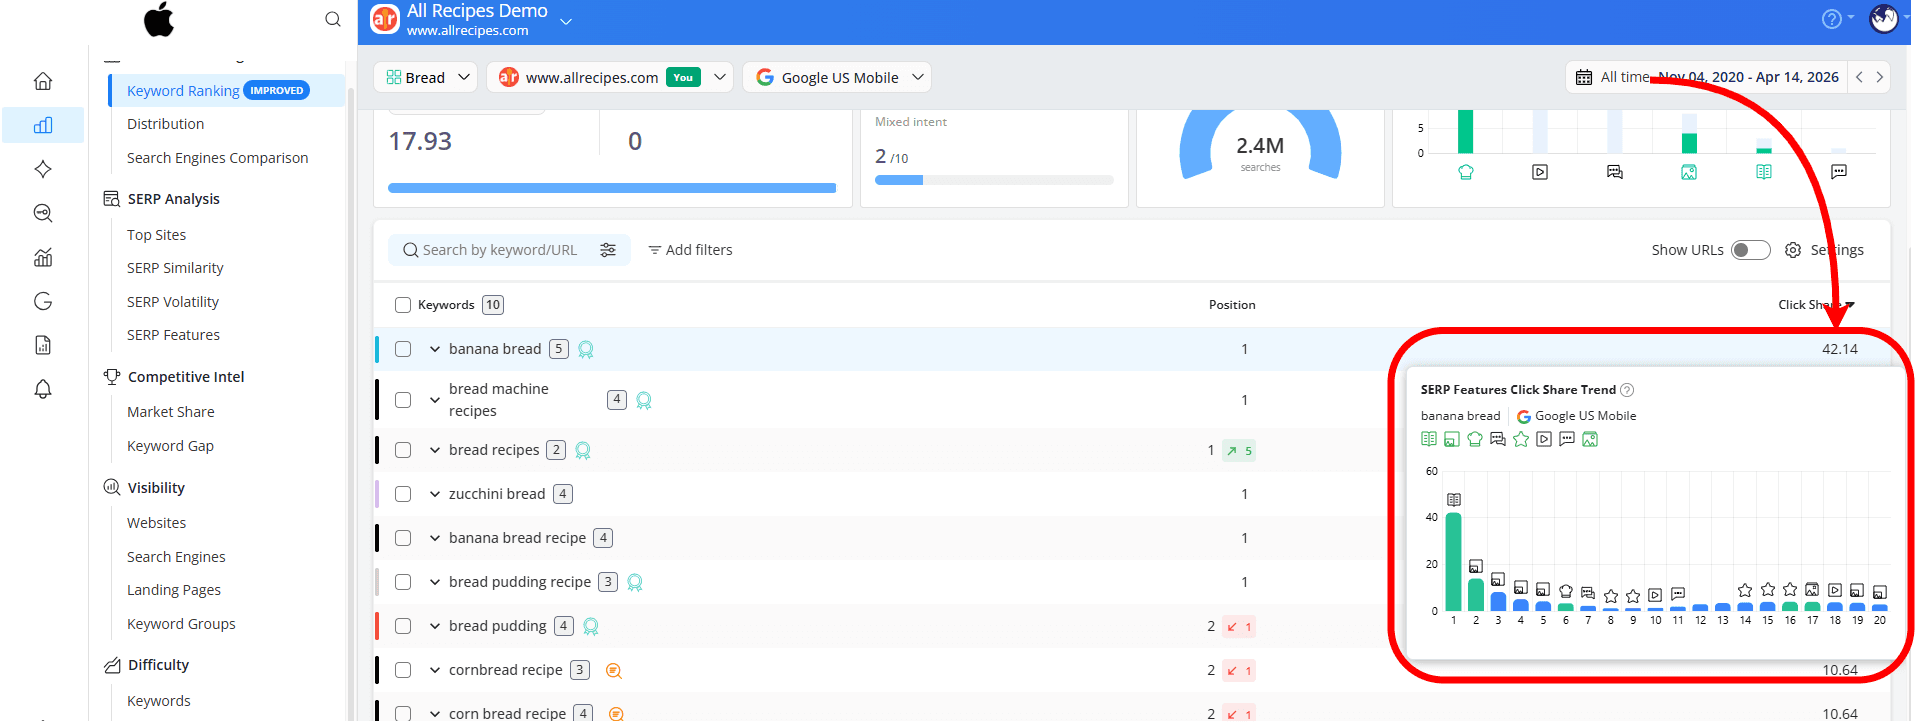
The chart shows how clicks are distributed across positions and SERP features, helping you better understand where the traffic opportunities are for that keyword.
When to use it: Click Share is useful when you want to get a clearer idea of how much traffic your current rankings can bring, identify the keywords that matter most and see how moving up in search results could impact your visits.
Why it’s helpful: Click Share helps you see what your rankings really mean in terms of potential traffic, so you can better understand where your opportunities are.
Market Share
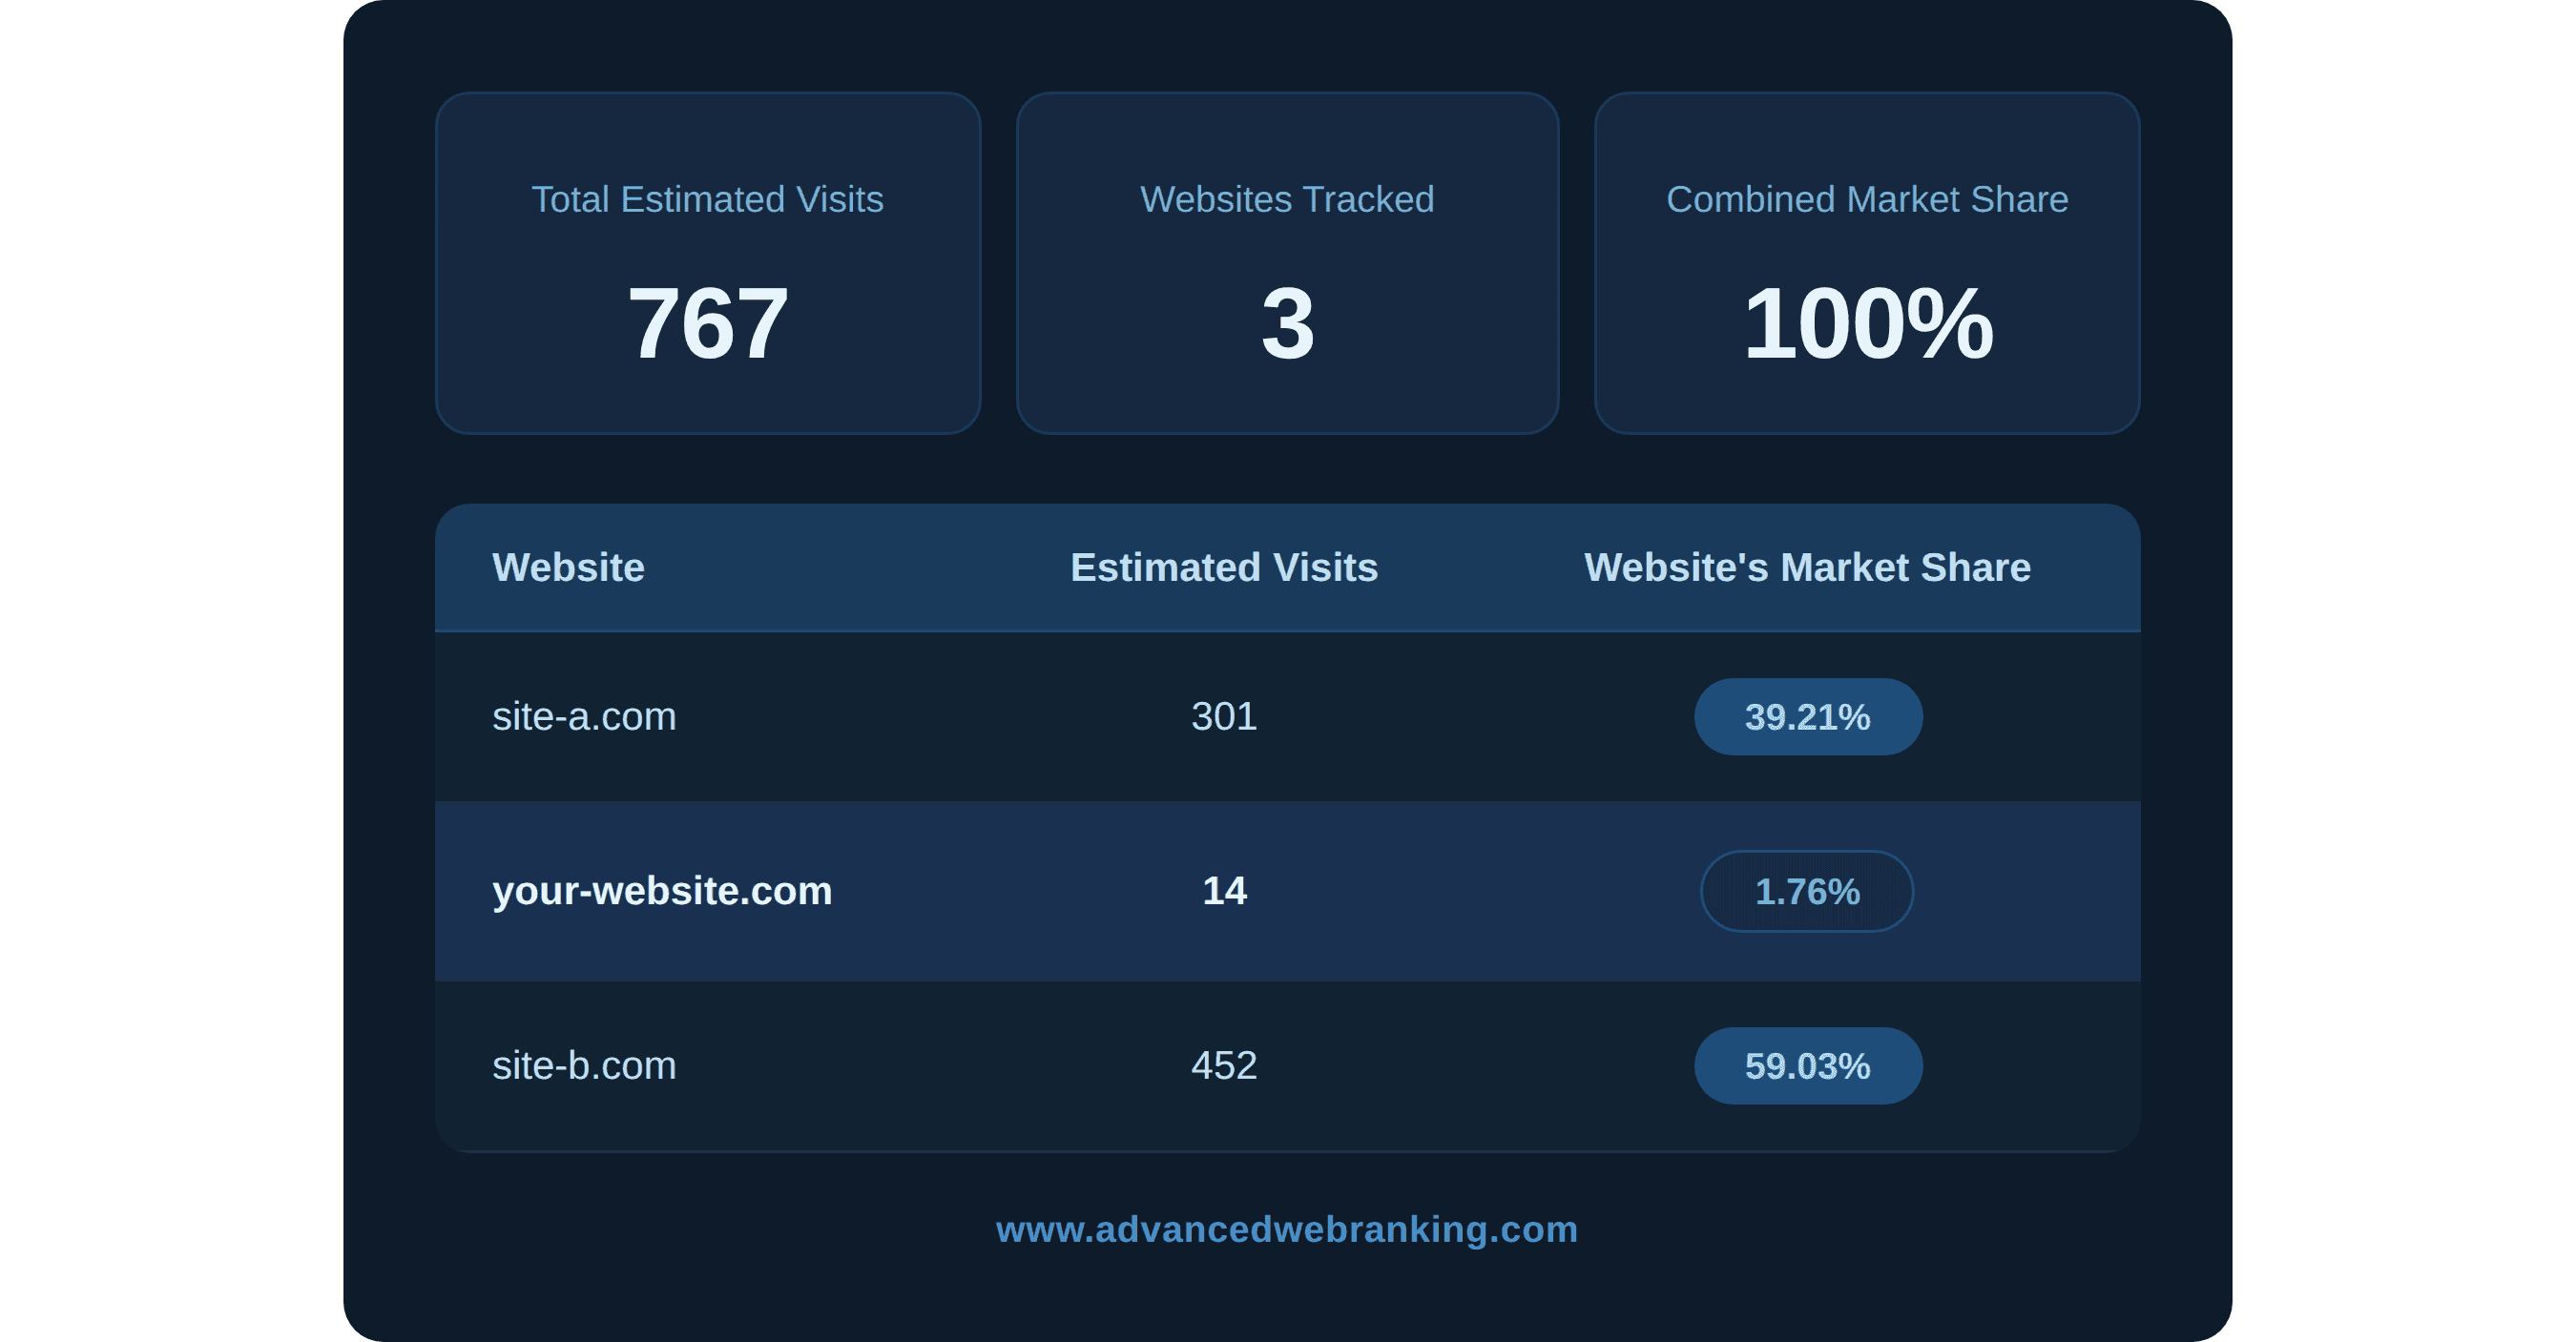
Market Share shows what percentage of the total estimated organic traffic your website captures compared to other top-ranking sites.
It helps you understand where you stand and how visible you are compared to others in your market.
How is it calculated?
Market Share is calculated by dividing your website’s estimated visits, which come from your rankings and search demand, by the total estimated visits of all competitors in your project.
Example
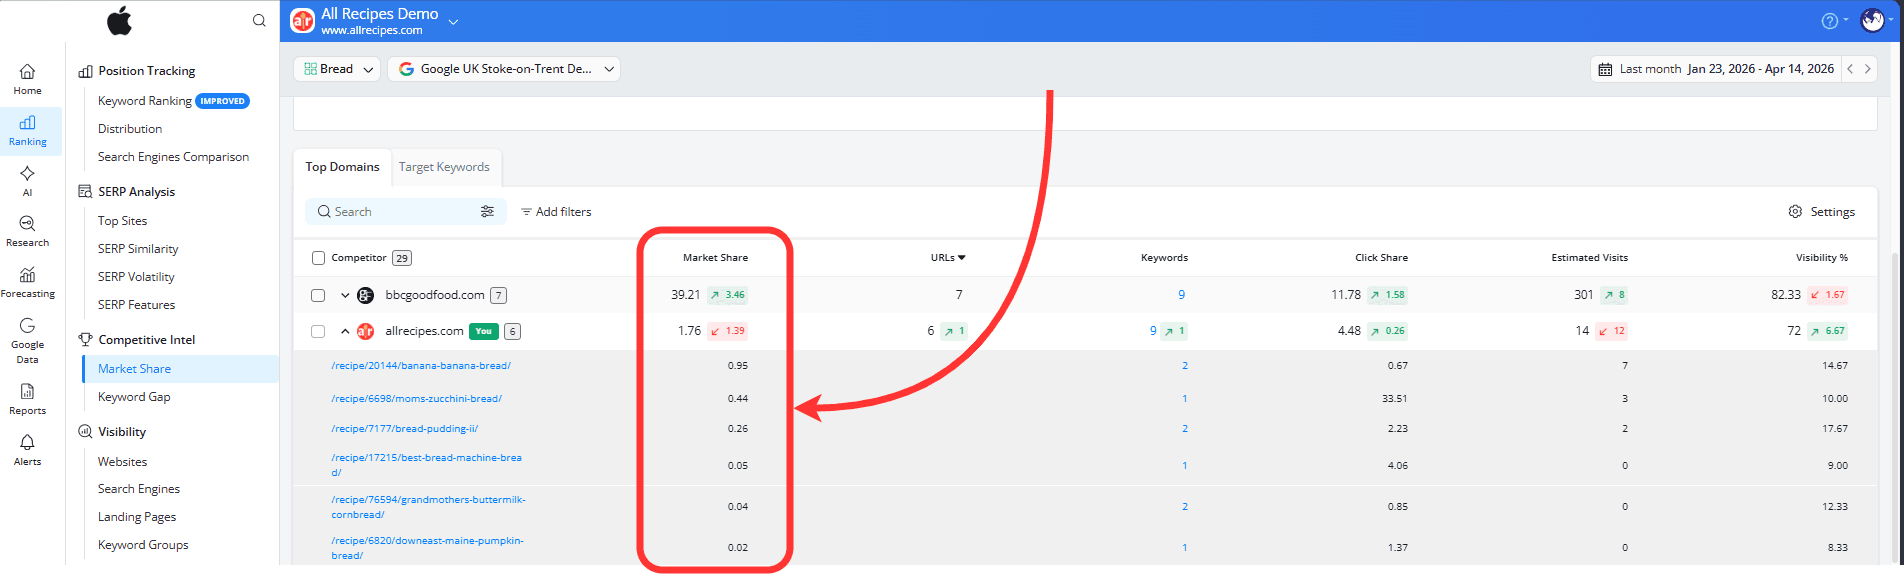
This metric is available at domain and URL level in the Market Share report:
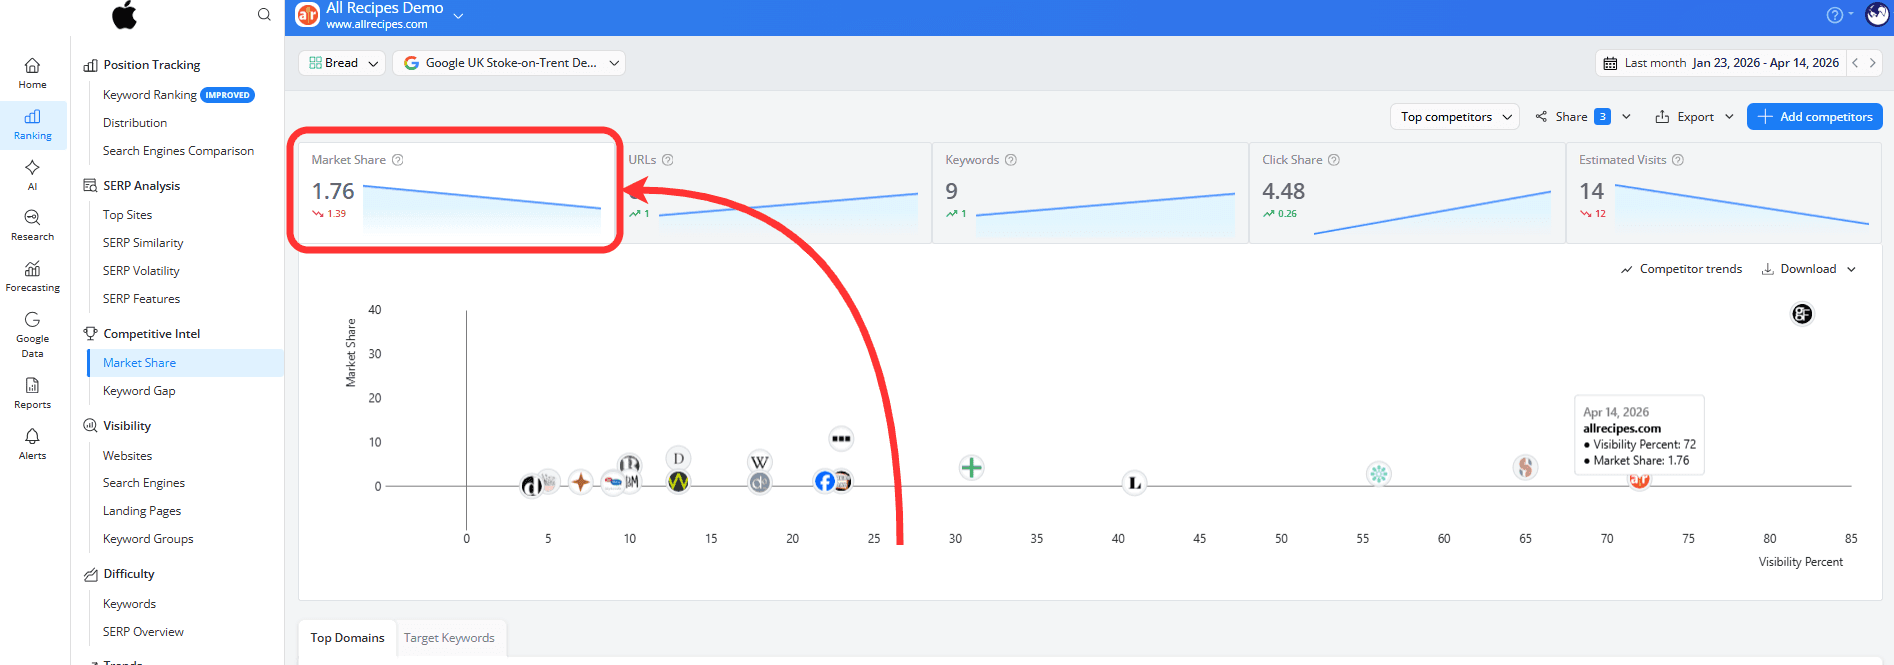
…and as the total estimated organic traffic your website receives, displayed in the top-left corner of the report:
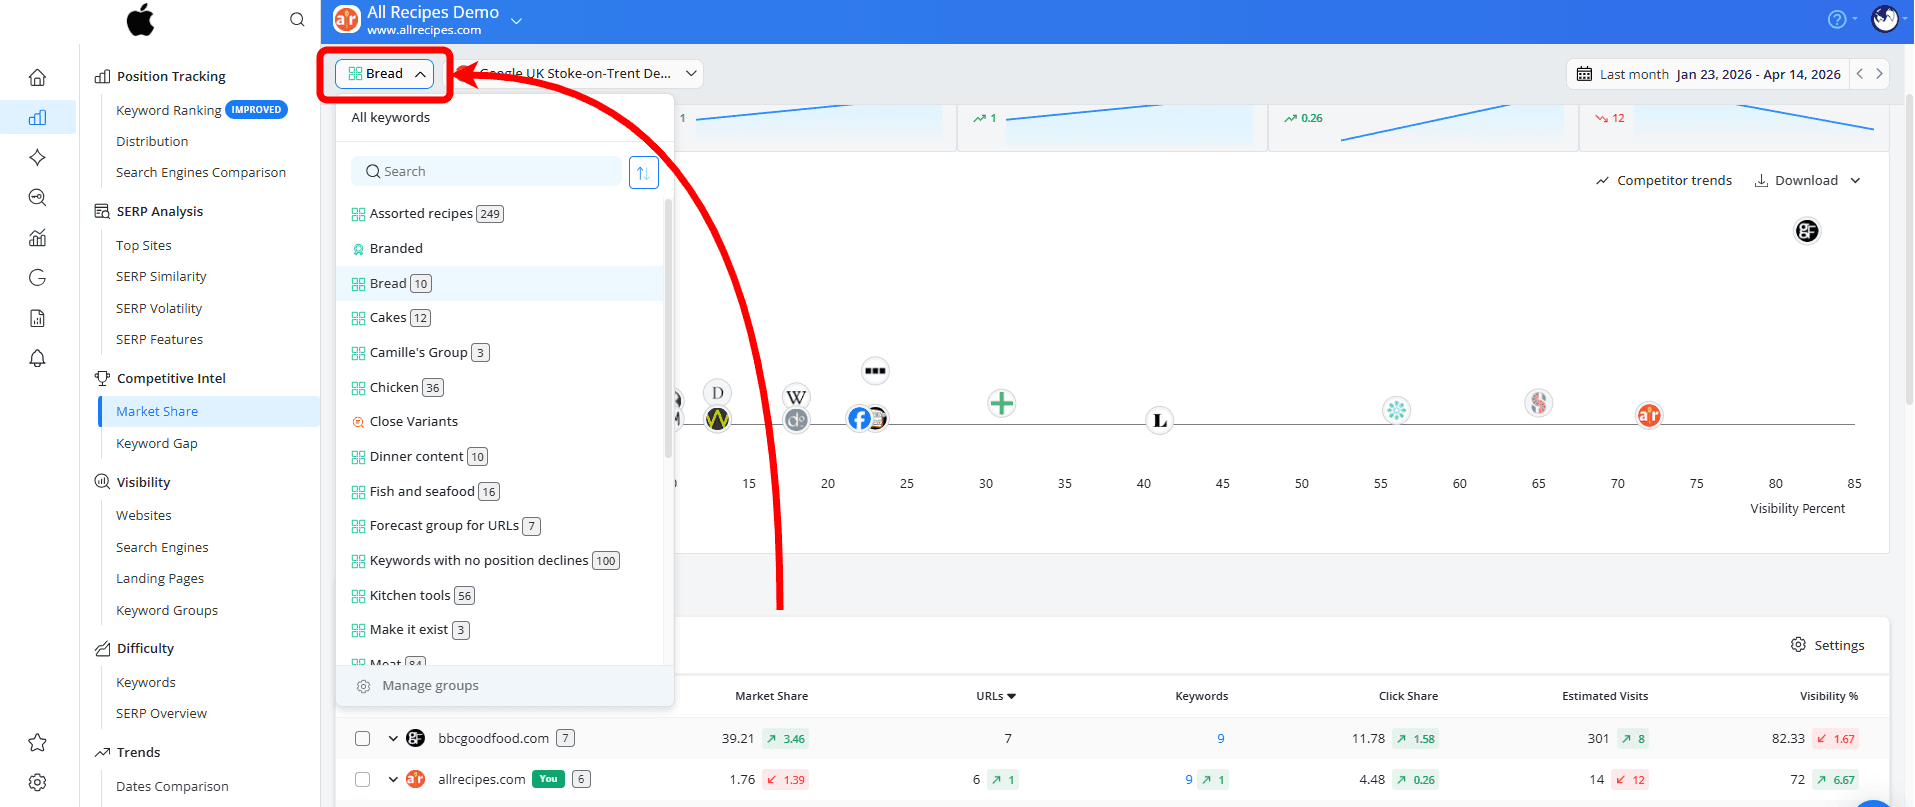
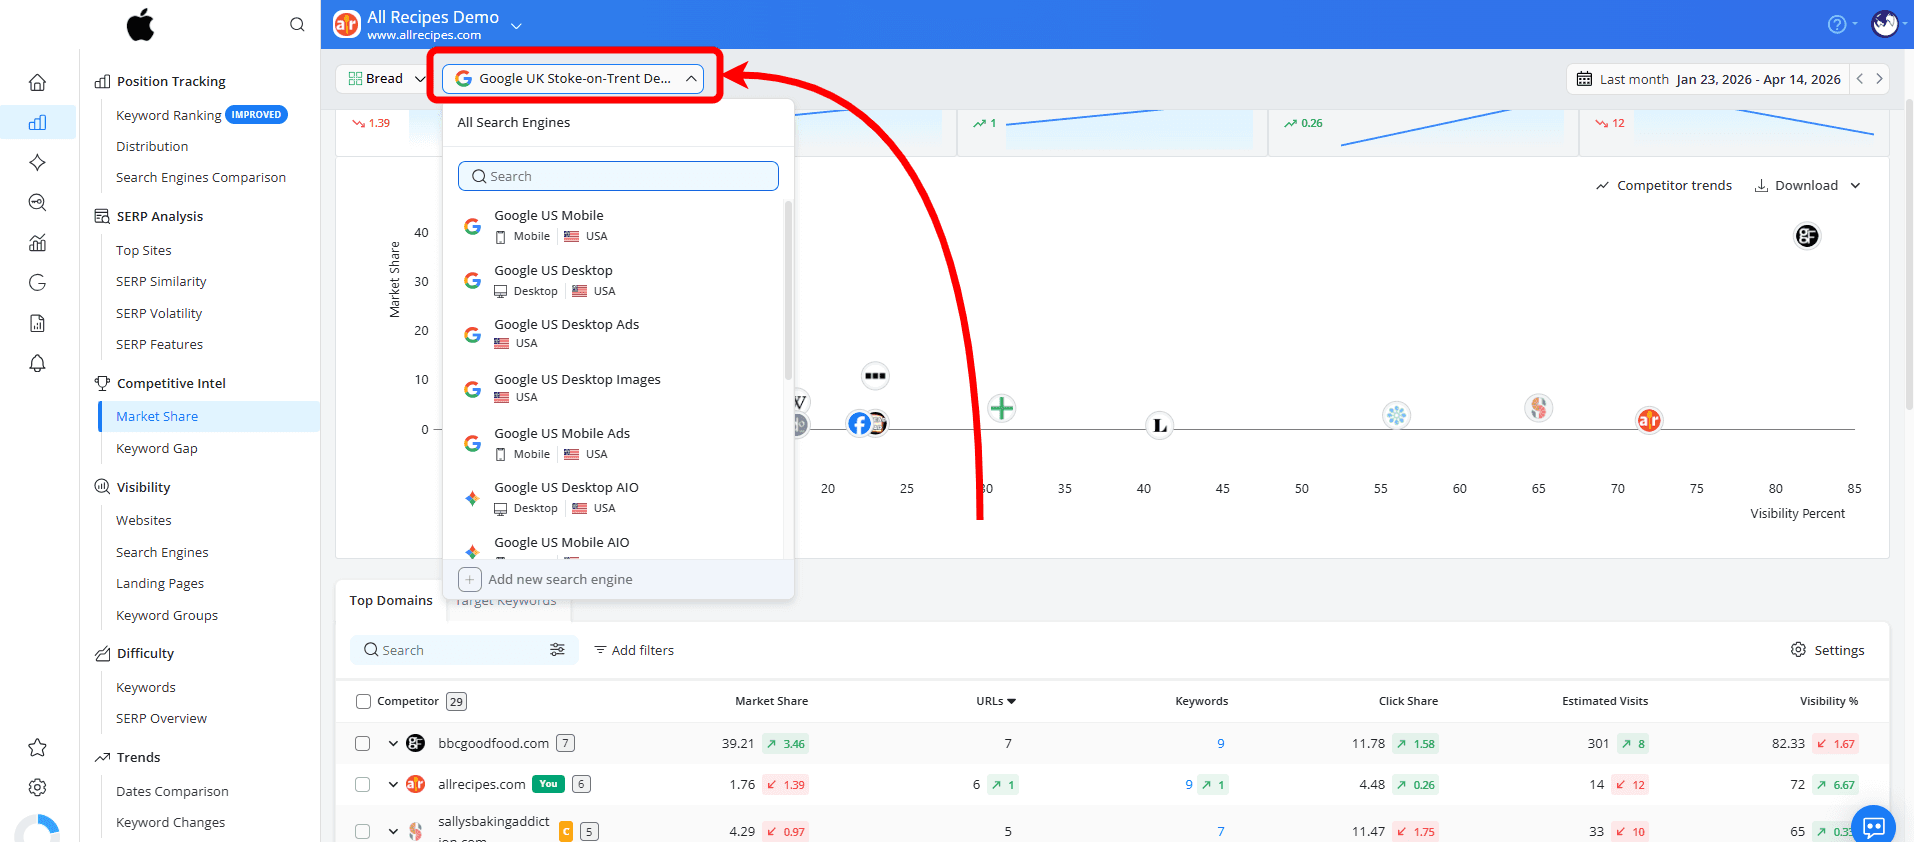
You can view Market Share for all the keywords in your project or focus on a specific keyword group by selecting it from the dropdown in the top-left corner of the screen.
You can also switch between search engines to compare how your Market Share changes across different locations or devices, or view the aggregated value across all your search engines.
When to use it: Market Share is useful when you want to quickly see where you stand, who’s ahead and how you compare to other websites in your market.
Why it’s helpful: Market Share helps you understand how your performance compares to others, not just how your site is doing on its own.
How these metrics work together in SEO workflows
Understanding what these metrics mean is important, but their real value comes from how they help you analyze performance, prioritize opportunities, and communicate results more effectively.
Visibility Score shows how strong your rankings are
Click Share helps you understand what those rankings mean in terms of traffic
Market Share shows how that traffic compares to your competitors
When building a report, it helps to look at them in this order:
Start with Market Share to quickly see where you stand compared to competitors. Then use Click Share to understand your traffic opportunities. Finally, look at Visibility Score to track how your rankings are improving and where you can grow further.
How to interpret these metrics
There’s no universal benchmark for a “good” Visibility Score, Click Share, or Market Share, since the values depend on your keywords, competitors, and project setup. Still, there are some general ways to interpret them.
For Visibility Score, steady growth over time usually indicates improving rankings across your tracked keywords. A score that consistently increases after optimizations or content updates is generally a positive sign.
For Click Share, higher values usually mean your rankings are more likely to bring visits to your website. Lower values may indicate that a keyword has less traffic potential, even if you rank well for it.
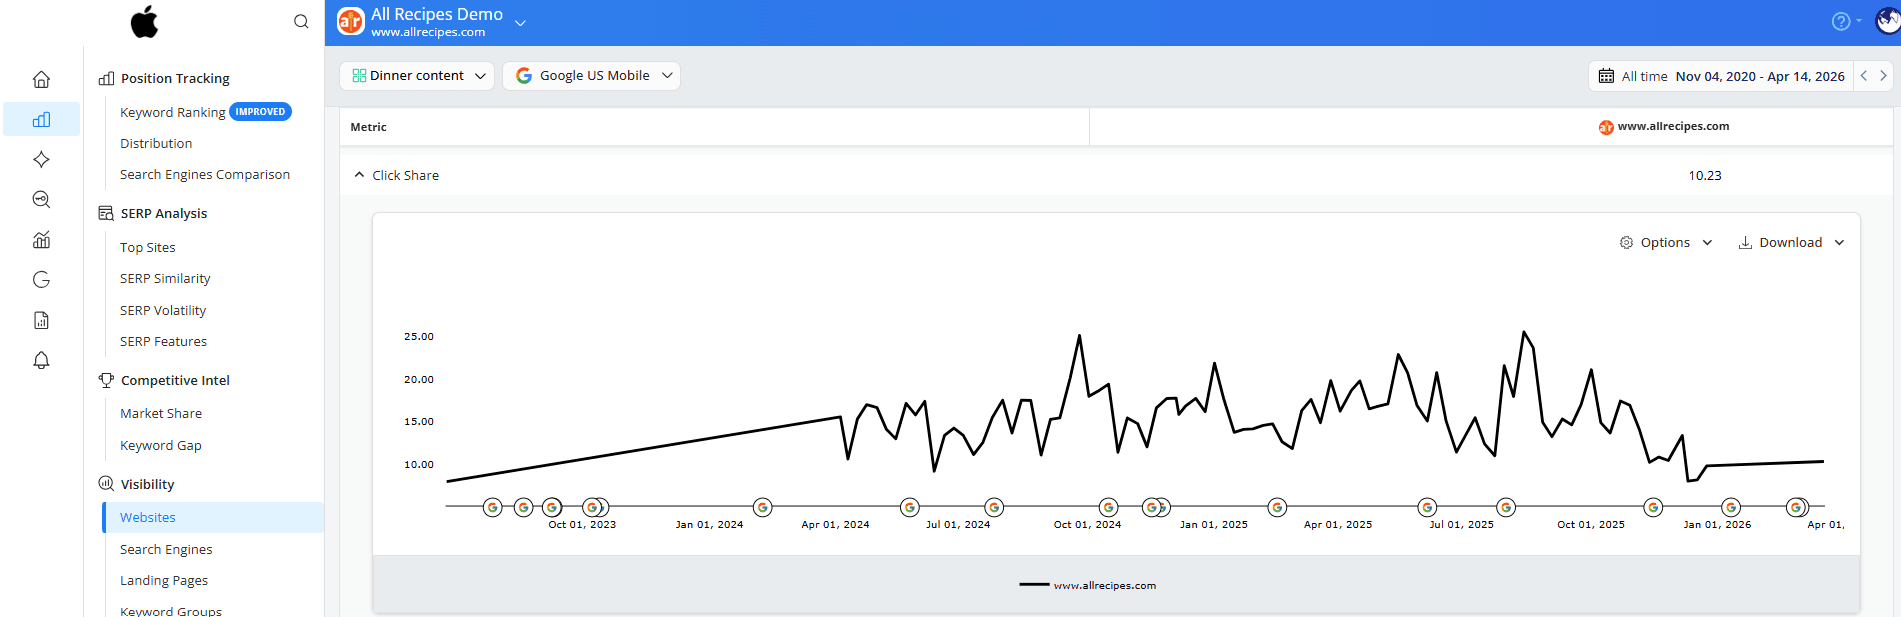
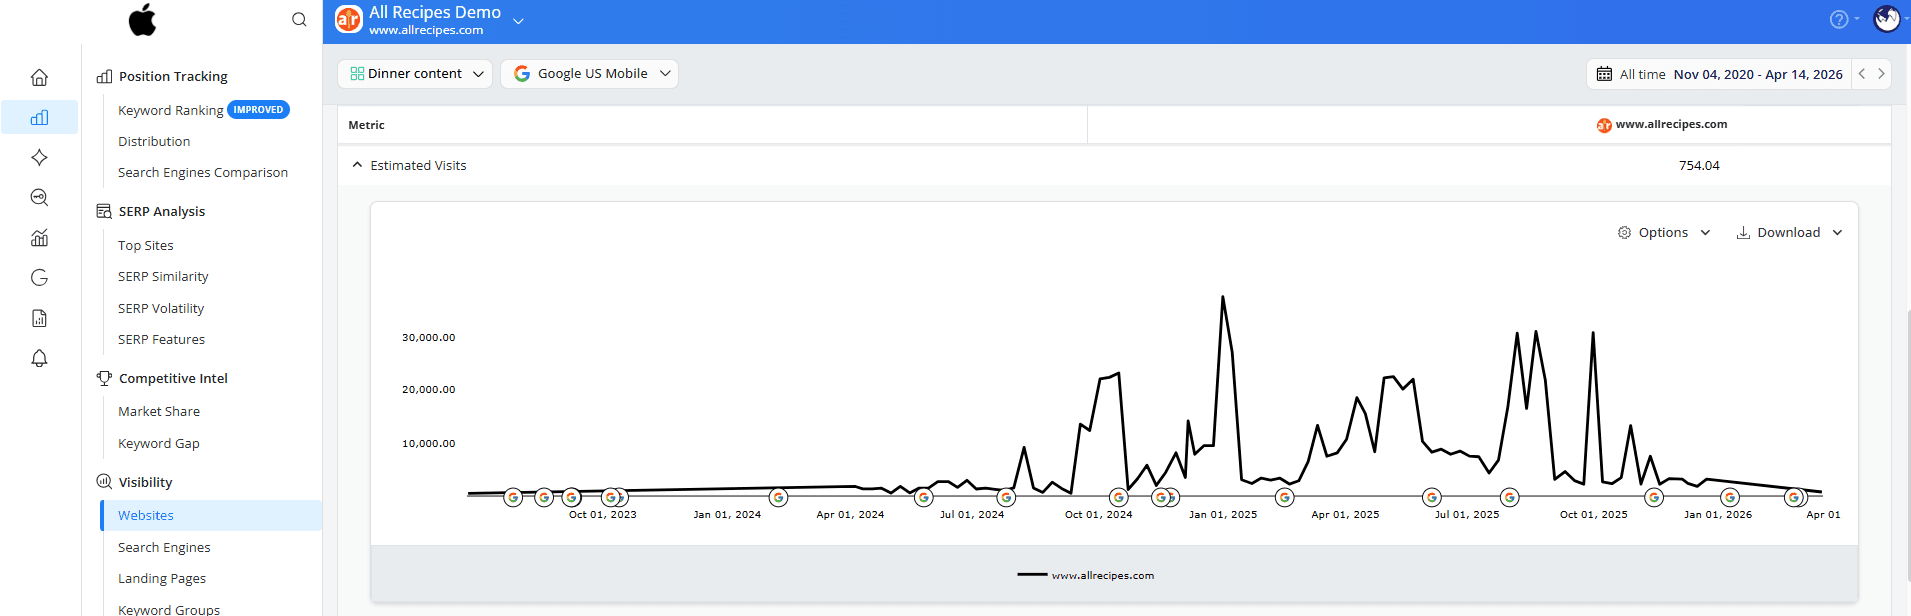
In this example, increases in Click Share are generally reflected in higher Estimated Visits as well, since stronger visibility tends to bring more potential traffic.
For Market Share, even small increases can be meaningful in competitive markets. A growing Market Share usually indicates that your website is gaining visibility compared to competitors.
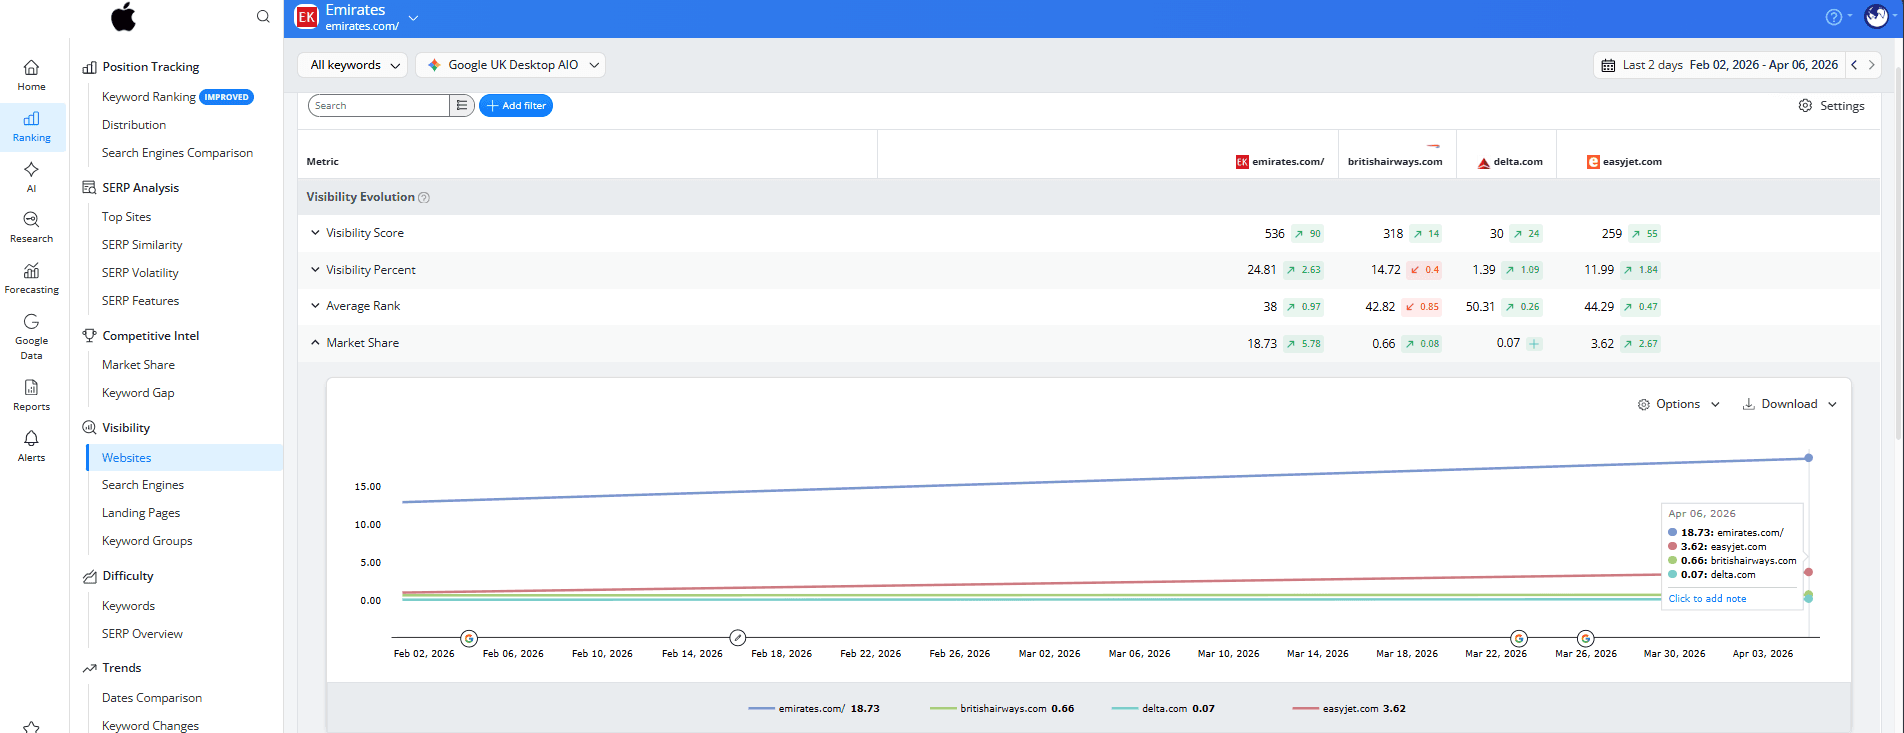
To compare your performance more easily, you can add competitors to your chart analysis using the Table Settings.
Do you have any questions? Don’t hesitate to get in touch and we will keep building the FAQ.
Frequently Asked Questions
Are the visibility metrics available for specific keyword groups?
Why does my Market Share change even if my rankings stay the same?
What happens if I remove or add keywords to my project?
Why does Click Share differ from CTR in Google Search Console?
stay in the loop