
Google's search results page looks different than it did a few years ago - more features, more AI Overviews, more ad real estate. Mobile clickthrough rates fell in Q1 2026. That alone would barely be worth a headline until you see what desktop CTRs did at the same time: they rose meaningfully.
This analysis breaks down the evolution of Google CTR values from Q4 2025 to Q1 2026. The data is pulled from an extensive industry-wide dataset consisting of millions of search terms and thousands of websites.
TLDR
User behavior is splitting even more by device type, with desktop searchers clicking more frequently and mobile users clicking less than just a quarter ago.
All ten websites ranked for branded searches on desktop were heavily impacted, witnessing changes in CTR ranging from 1.99 pp to 5.78 pp increase for a single position.
Keyword length didn't matter: both short- and long-tail queries saw shifts in their clickthrough rates.
As many as 22 distinct industries were impacted by the recent CTR shifts.
CTR changes occurred across all types of search intent.
Law, Government, & Politics is the industry with the highest decrease in clickthrough rate for a single position (websites ranked first on mobile dropped by 9.03 pp in CTR).
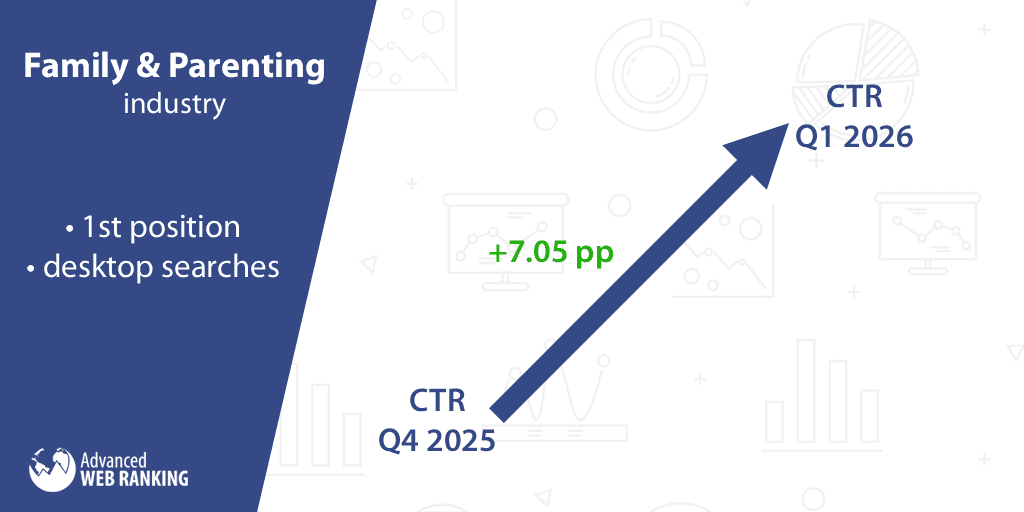
The highest increase in CTR for a single position was recorded in the Family & Parenting industry (the CTR for the websites ranked first on desktop grew by 7.05 pp).
Methodology
We calculated the CTR averages for each position for Q1 2026 (January-March interval) and compared them against the ones retrieved for Q4 2025 (October-December). All significant changes were included in this analysis and expressed as percentage points (pp).
The data set is international and comprises all the available markets, such as the US, UK, etc.
Since clicks and impressions go hand in hand when projecting estimated traffic, we also correlated these CTR changes with search demand data at an industry level.
For each industry, we determined the average number of impressions in Q1 2026, compared it to Q4 2025, and expressed the difference as a percentage.
CTR Shifts Across All Searches
When aggregating data across all industries, the first five positions’ clickthrough rates for desktop queries increased by a combined 10.54 pp compared to the previous quarter. Simultaneously, on mobile, only the websites ranked first were affected, witnessing a 2.20 pp decline in CTR.
CTR Shifts in Branded vs. Unbranded Queries
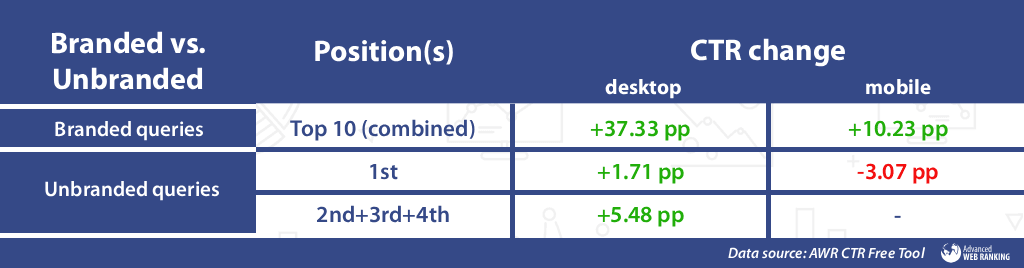
When users search for a specific brand, their intent is high, and they are significantly more likely to click through. And this quarter, the benchmark clickthrough rates grew even more, especially on desktop. More precisely, for searches containing particular brand or business names, all top ten positions were heavily impacted, witnessing a growth in CTR ranging from 1.99 pp to 5.78 pp for a single position.
Interestingly, this brand loyalty doesn't translate as aggressively to mobile. The shift on mobile devices remained marginal, hovering around a mere 1 pp increase for various top 10 positions.
Meanwhile, the websites ranked in the first four positions for unbranded queries recorded a combined 7.19 pp growth in CTR on desktop.
As for the mobile queries, the changes affected the websites ranked first for unbranded searches only, which experienced a 3.07 pp decline in CTR.
CTR Shifts by Search Intent
For informational queries (containing words such as what, when, where, how, etc.), the CTR values experienced contrasting changes this time. Here, on desktop, the website holding the first position witnessed a 1.24 pp growth, while those in the third and fourth positions recorded increases of 1.41 pp and 1.21 pp, respectively. Simultaneously, on mobile, the websites ranked in the first two positions witnessed a combined 5.75 pp loss in CTR (3.97 pp for those ranked first and 1.78 pp for those ranked second).
The websites ranked in the first five positions for commercial queries (containing words such as buy, price, etc.) recorded a combined 12.09 pp boost in CTR on desktop, while on mobile queries only the first two positions saw their clickthrough rates affected, recording a combined 5.75 pp drop.
As for location searches, the websites ranked first on mobile recorded a 1.60 pp drop in clickthrough rate. Surprisingly, on desktop, the websites ranked first weren’t influenced by the changes, while the websites ranked second and third witnessed an identical CTR boost (1.26 pp).

CTR Shifts by Keyword Length
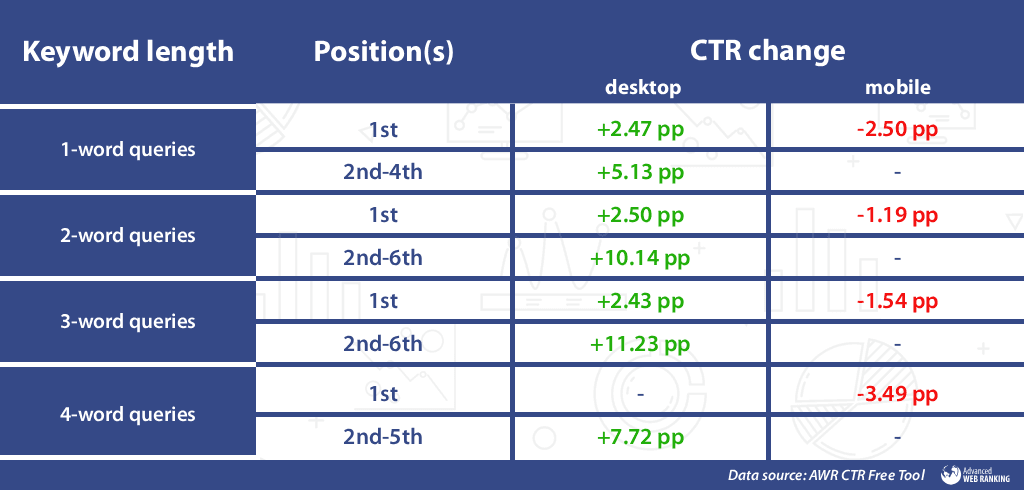
Regardless of the number of words a keyword has, our CTR tool recorded changes on almost all fronts as follows:
for 1-word queries, the websites ranked in the first four positions recorded a combined 7.60 pp increase in CTR on desktop, while on mobile, only the websites ranked first were affected, experiencing a 2.50 pp drop in CTR.
for 2-word queries, the top six websites registered a combined 12.64 pp growth on desktop, while on mobile, the websites ranked first were the only ones influenced by changes, witnessing a 1.19 pp drop in CTR.
for 3-word queries, a similar trend to the 2-word queries occurred, with the same positions being affected by the changes. More precisely, the first six websites recorded a combined 13.66 pp boost on desktop, while on mobile, the websites ranked first registered a 1.54 pp loss.
for queries containing 4 or more words, the growth in CTR for the websites ranked in positions 2-5 on desktop equaled a combined 7.72 pp, while on mobile, the websites holding the first position suffered a negative impact on their clickthrough rates (3.49 pp).
Winning and Losing Industries by CTR Evolution
Search demand integration helps us build a more detailed picture of organic traffic trends across industries rather than relying exclusively on rankings.
This perspective links CTR changes with fluctuations in search demand. Traffic expands when both demand and CTR increase together, and contracts when both decline.
The chapter is structured around shifts in search demand between quarters.
A. Industries that experienced an increase in search demand
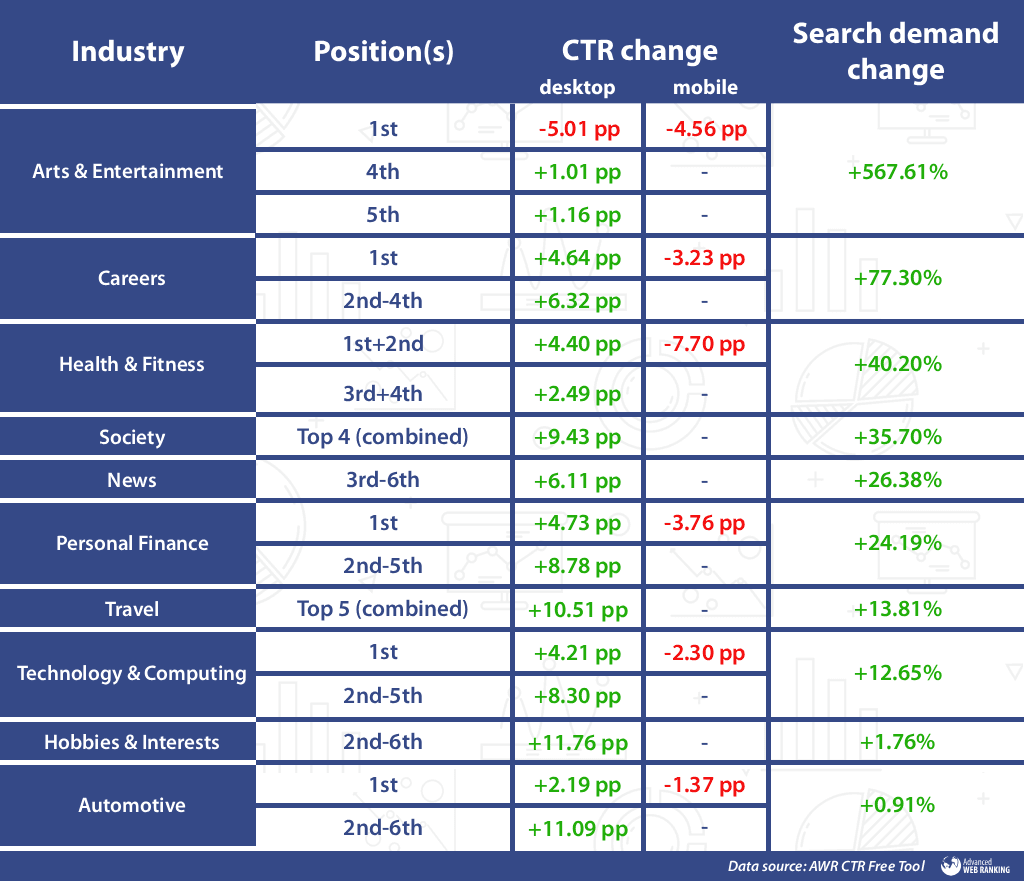
With a massive +567.61% growth in search demand, the CTR values experienced contrasting changes in the Arts & Entertainment industry. Here, on desktop, the website holding the first position witnessed a 5.01 pp loss, while those in the fourth and fifth positions recorded increases of 1.01 pp and 1.16 pp, respectively. Simultaneously, on mobile, the websites ranked first witnessed a 4.56 pp loss in CTR.
In the Careers industry, the websites ranked in the first four positions on desktop registered a combined 10.96 pp increase in clickthrough rate. As for the mobile queries, the CTR changes went in the opposite direction and affected the websites ranked first only, which recorded a 3.23 pp decline. Here, the search demand grew, recording a +77.30% boost.
Desktop and mobile CTR values went in opposite directions this time around in the Health & Fitness market. On desktop, the top four ranked websites experienced a combined 6.89 pp boost in clickthrough rate. In contrast, the situation was reversed on mobile devices, where the websites ranked in the first two positions witnessed a combined 7.70 pp loss in CTR. Simultaneously, the industry’s overall search demand recorded a +40.20% growth.
A consistent trend emerged across four industries, with rising CTRs on desktop and no changes on mobile devices:
The websites ranked in the first four positions on desktop in the Society category recorded a combined 9.43 pp increase in CTR, while the industry’s total number of impressions grew by +35.70%
In the News industry, the websites ranked in positions 3-6 on desktop experienced a combined 6.11 pp increase in CTR. Meanwhile, the search demand for this industry increased by +26.38%.
As for the Travel industry, the clickthrough rates for the top four ranked websites registered a combined boost of 10.51 pp on desktop. The search demand for this industry recorded growth when compared to the previous quarter (+13.81% to be more precise).
With a slight increase in search demand (+1.76%), the websites ranked in positions 2-6 on desktop in the Hobbies & Interests market received more clicks by 11.76 pp combined.
The websites ranked in the first five positions on desktop in the Personal Finance industry attracted more clicks than in the previous quarter, witnessing a combined 13.51 pp boost in CTR. Conversely, on mobile, the changes affected the websites ranked first only, which registered a 3.76 pp drop in CTR, while the industry’s total search demand grew by +24.19%.
A similar trend occurred in the Technology & Computing industry, where, just like in the Personal Finance market, the very same positions were affected, while the impressions increased (by +12.65%). Here, the websites ranked in the first five positions on desktop recorded a combined 12.51 pp growth in CTR, while on mobile, the websites ranked first registered a 2.30 pp drop.
One last market where the search demand grew slightly (by +0.91%) is Automotive. Here, on desktop, the websites ranked in the first six positions witnessed a combined 13.28 pp growth in clickthrough rate. These gains stood in sharp contrast to mobile performance, where the websites ranked first suffered a 1.37 pp decline in CTR.
Here’s a visual round-up of the CTR evolution in all ten industries mentioned above:
B. Industries where the search demand dropped
Let’s start this section in force, with the industry with the highest growth in clickthrough rate for a single position: Family & Parenting. Here, the CTR for websites ranked first on queries made from desktop devices increased, on average, by a remarkable 7.05 pp.
The growth affected the websites ranked in the second, third and fourth positions on desktop, as well, which recorded a combined 5.95 pp increase in CTR.
As for the mobile queries, the websites holding the top three spots witnessed a combined 8.88 pp loss. Alongside these changes, the industry’s overall search demand fell by -2.50%.
With a -47.17% decline in search demand, the CTR values experienced contrasting changes in the Pets industry. Here, on desktop, the website holding the first four positions witnessed a combined 7.77 pp growth. Simultaneously, on mobile, the websites ranked first registered 1.25 pp loss in CTR.
The Business market also recorded mixed CTR results across devices. On desktop, the websites ranked in positions 2-6 experienced a combined 10.18 pp boost in clickthrough rate, while on mobile, the websites holding the first spot witnessed a 3.31 pp loss. Alongside these changes, the industry’s overall search demand fell by -29.92%.
In the Food & Drink category, surprisingly, the websites ranked first weren’t quite influenced by the changes. However, those ranked in positions 2-5 recorded a combined 6.03 pp boost in CTR on desktop, while the market’s search demand contracted by -27.18%.
Good news for the websites ranked in the first eight positions on desktop in the Shopping sector, as they witnessed a growth in CTR by a combined 18.54 pp. Meanwhile, the aggregated search demand within the industry declined by -16.62%.
The websites ranked in the first ten positions on desktop in the Sports industry attracted more clicks than in the previous quarter, witnessing a combined 19.74 pp increase in CTR. On mobile, only the websites ranked first were influenced by the changes, recording a 1.43 pp growth. It remains to be seen if this boost in clickthrough rate can compensate for the decline in traffic resulting from the slight decrease in search demand (-16.29%).
Despite recording a drop in search demand (-13.01%), there’s still a glimmer of hope for the websites in the Home & Garden industry. Or, at least for the websites ranked in the first six positions on desktop searches, which recorded a combined 16.69 pp increase in clickthrough rate.
Being the industry to record the highest decline in clickthrough rate in the previous quarter, Education experienced contrasting changes this time. Here, the websites ranked in positions 2-8 on desktop recorded a combined 12.76 pp boost in CTR. As for the mobile queries, only the websites ranked in the first two positions were influenced by the changes, recording a combined 7.06 pp decline, while the industry’s overall search demand decreased by -6.82%.
And now let’s jump to the industry with the highest decrease in clickthrough rate for a single position: Law, Government, & Politics. Here, the CTR for websites ranked first on mobile dropped, on average, by a remarkable 9.03 pp.
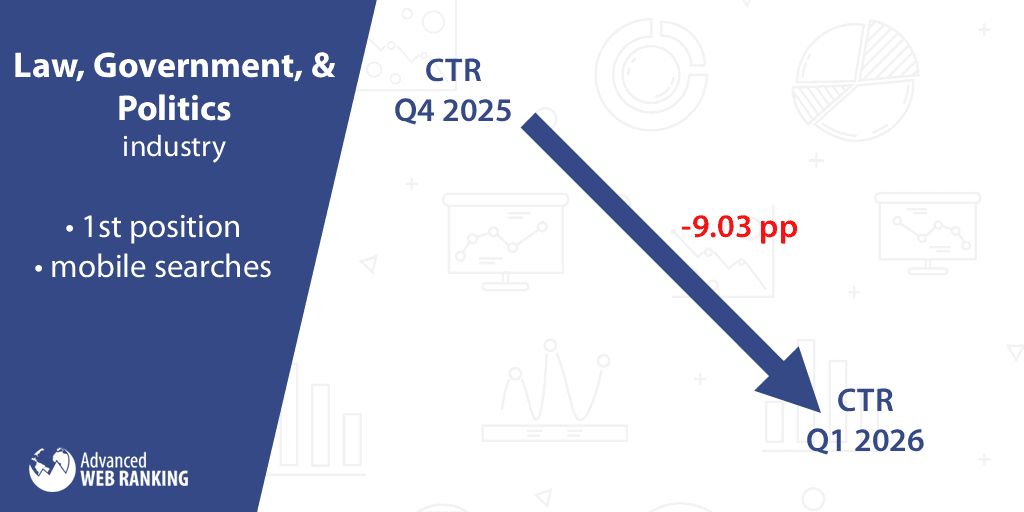
The decline extended to the websites ranked second on mobile, as well, which recorded a 1.97 pp decline in CTR. As for the desktop queries, the top six positions experienced a combined 21.00 pp growth, while this market’s total number of impressions decreased by -3.97%.
The Style & Fashion industry continued on an ascending trend since the previous quarter when it was proclaimed the market with the highest clickthrough rate growth. In contrast to a -30.82% decrease in search demand, the CTR for the websites ranked in the first six positions on desktop experienced a combined 20.02 pp growth in CTR, while on mobile, the changes affected the websites ranked first only, which witnessed a 1.60 pp increase in CTR.
A massive ascending trend was recorded in the Real Estate market, where the top 10 websites ranked on desktop witnessed a combined 21.80 pp boost in CTR. Conversely, on mobile, the changes affected the websites ranked first only, which registered a 1.89 pp drop in CTR, while the industry’s total search demand contracted slightly, by -0.95%.
Last but not least, with an almost insignificant change in search demand (-0.81%), the Science market recorded changes on both desktop and mobile devices. The websites holding the top three positions on mobile registered a combined 8.31 pp decline, while on desktop, the changes affected the websites ranked first only, which witnessed a 5.65 pp growth in CTR.
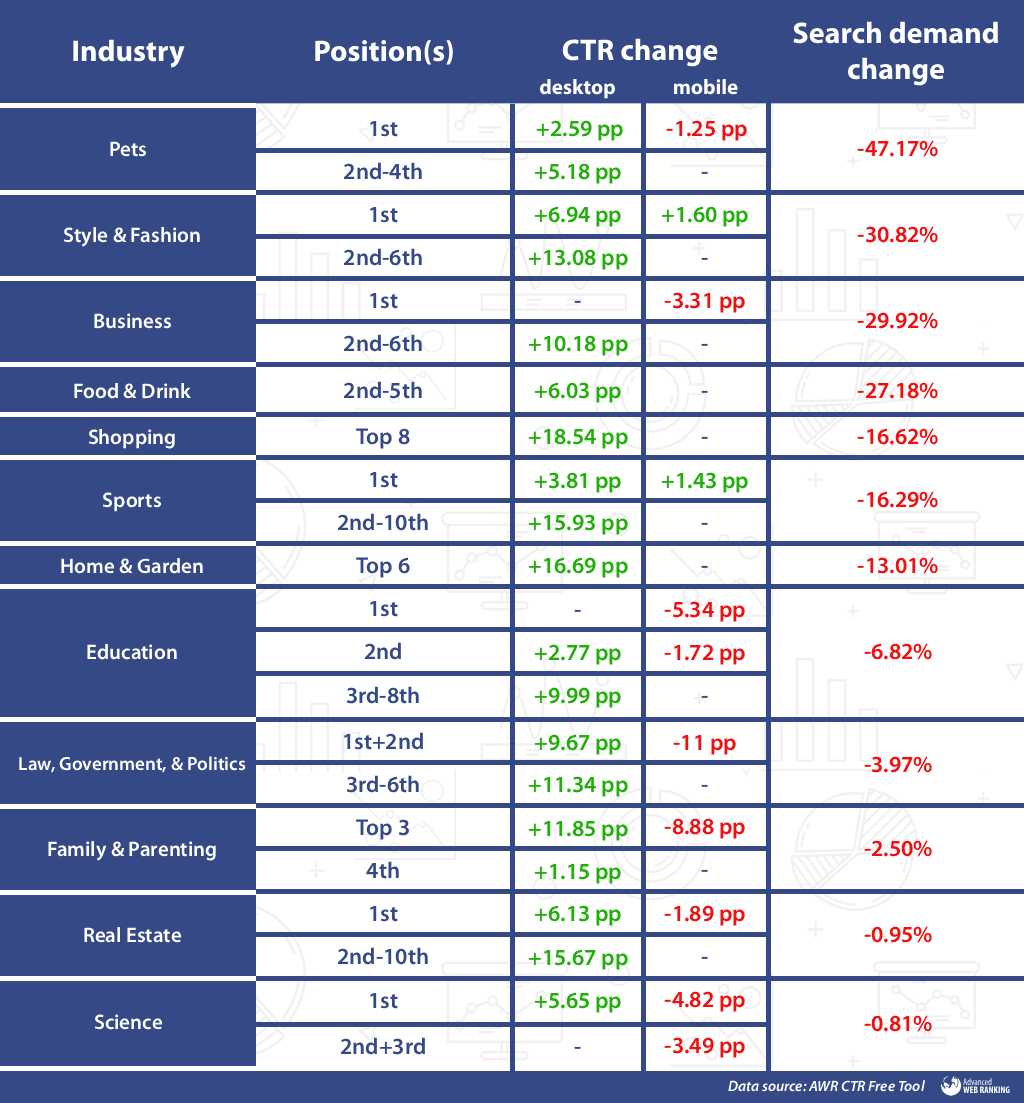
Here’s a graphical summary of all the changes presented above:
That’s it for…the first quarter
The transition into 2026 confirms that click behavior has fundamentally decoupled by device type. Across 22 distinct industries, regardless of keyword length or user intent, a definitive pattern has hardened: desktop CTRs are experiencing a major comeback, while mobile values face a steady squeeze.
What does this cross-device split mean for your brand?
Every industry is feeling the effects of this platform divide, but your data is uniquely yours. Advanced Web Ranking allows you to move past one-size-fits-all metrics by tracking your URLs' actual pixel depth against your real-world CTR on both desktop and mobile.
See exactly how Google's evolving layouts are shaping your clicks. Start your free AWR trial today to unlock the full story behind your clicks.
Keep an eye out for our upcoming Q2 2026 analysis, where we will dive deeper into the ongoing evolution of clickthrough rates. Until then, stay safe and healthy!

Article by
Dan Popa
Dan Popa is an Online Marketing Strategist at Caphyon. He is passionate about both Online and Offline Marketing and he's always looking for new ways of applying the basic principles of marketing in the fast-evolving SEO field. He's always in the mood to chat about new creative ideas for campaigns, so you can find him on Twitter.


