
In an era where ‘zero-click searches’ are pushing organic traffic to new lows, our latest analysis for Q4 2025 reveals a fascinating paradox: a significant surge in desktop CTRs.
Key takeaways
The analysis reveals a recurring pattern: desktop CTR is rising while mobile CTR is declining.
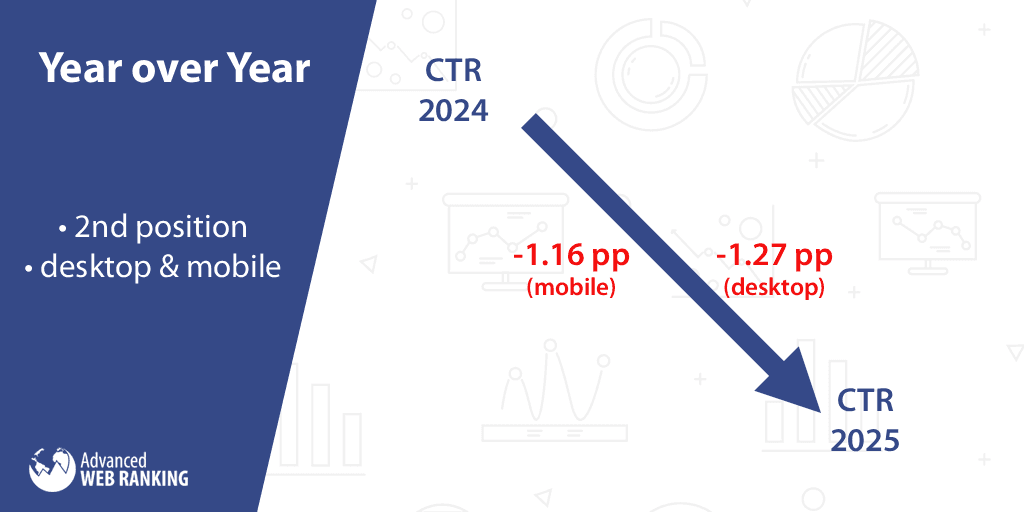
A 2025 vs. 2024 comparison reveals CTR declines for second-ranked sites (1.16pp on mobile and 1.27 pp on desktop).
All twenty websites ranked for branded searches on desktop were heavily impacted, witnessing changes ranging from 0.87 pp to 7.46 pp increase for a single position.
Both short- and long-tail queries saw their CTR affected.
There were no fewer than 22 industries affected by the changes.
CTR fluctuations were recorded on all intent types.
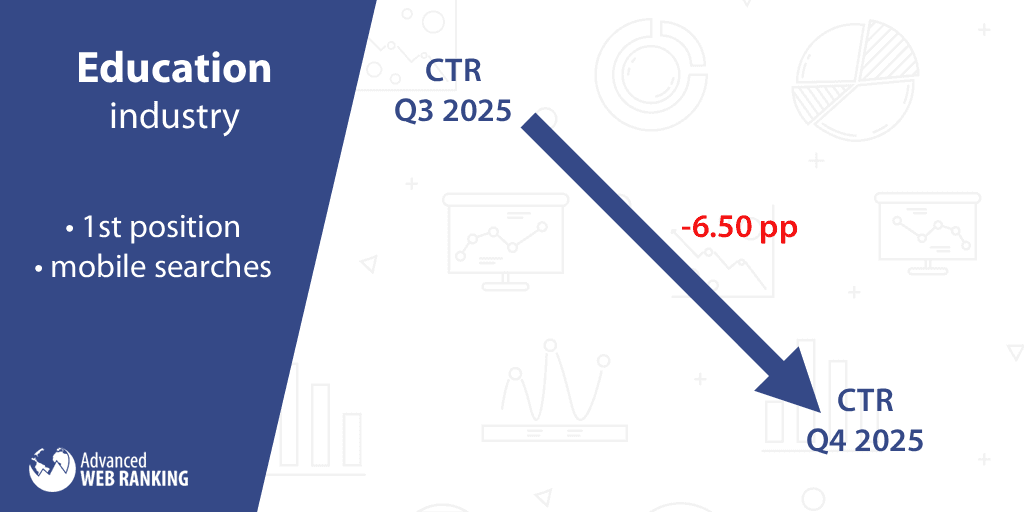
Education is the industry with the highest decrease in clickthrough rate for a single position (websites ranked first on mobile dropped by 6.50 pp in CTR).
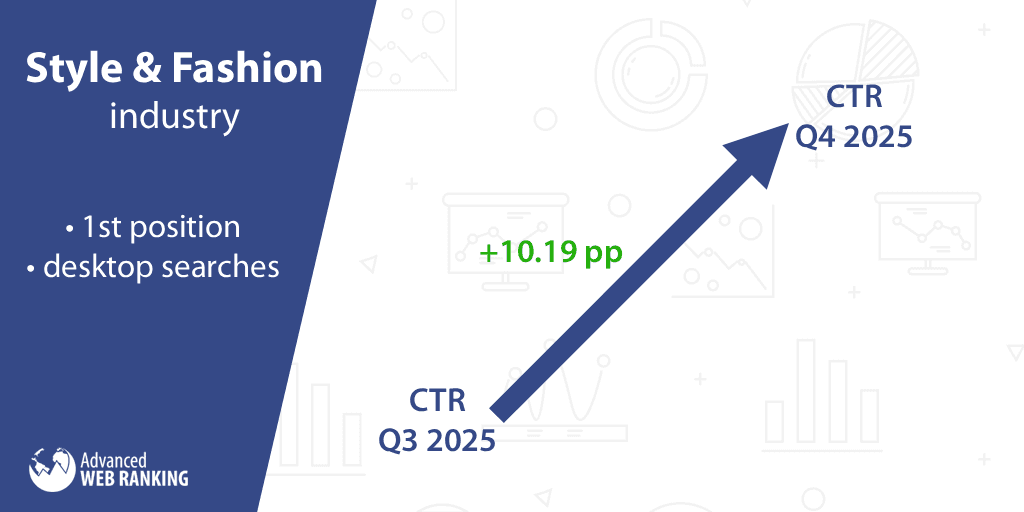
The highest increase in CTR for a single position was recorded in the Style & Fashion industry (the CTR for the websites ranked first on desktop grew by 10.19 pp).
In this analysis, we’ll take a closer look at the data to understand exactly how the Google CTR values evolved in the fourth quarter of the year. The findings are based on a broad dataset compiled from thousands of sites and millions of keywords.
Methodology
We calculated the CTR averages for each position for Q4 2025 (October-December interval) and compared them against the ones retrieved for Q3 2025 (July-September). All significant changes were included in this analysis and expressed as percentage points (pp).
The data set is international and comprises all the available markets, such as the US, UK, etc.
Since clicks and impressions go hand in hand when projecting estimated traffic, we also correlated these CTR changes with search demand data at an industry level.
For each industry, we determined the average number of impressions in Q4 2025, compared it to Q3 2025, and expressed the difference as a percentage.
CTR in 2025 vs. 2024
Before analyzing the quarterly performance, let's first examine the broader year-over-year trends by comparing 2025’s performance against 2024.
While most of the clickthrough rate values remained relatively stable, the most significant changes occurred for the websites ranked second on both mobile and desktop devices. Specifically, the websites ranked second on mobile saw a decrease of 1.16 percentage points (pp) in CTR in 2025 compared to 2024, while on desktop the decrease was even greater at 1.27 pp.
Moving from these annual trends, let’s look at how user behavior shaped the organic CTR values in the fourth quarter of the year compared to the previous one.
CTR Shifts Across All Searches
Aggregating data across all industries, the first six positions’ clickthrough rates for desktop queries increased by a combined 11.58 pp compared to the previous quarter. Simultaneously, on mobile, only the websites ranked first were affected, witnessing a 1.81 pp drop in CTR.
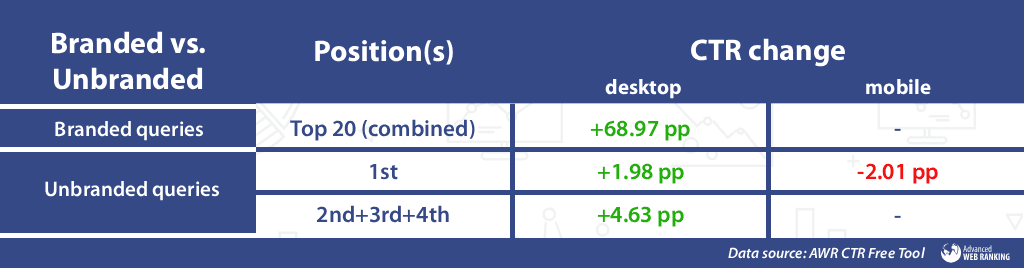
CTR Shifts in Branded vs. Unbranded Queries
The growth in CTR on desktop and decline on mobile pattern was also reflected when segmenting by branded and unbranded queries. Specifically, for searches containing particular brand or business names, all twenty websites were heavily impacted, witnessing changes ranging from 0.87 pp to 7.46 pp increase for a single position.
Meanwhile, the websites ranked in the first four positions for unbranded queries recorded a combined 6.61 pp growth in CTR on desktop.
As for the mobile queries, the changes affected the websites ranked first for unbranded searches only, which experienced a 2.01 pp decline in CTR.
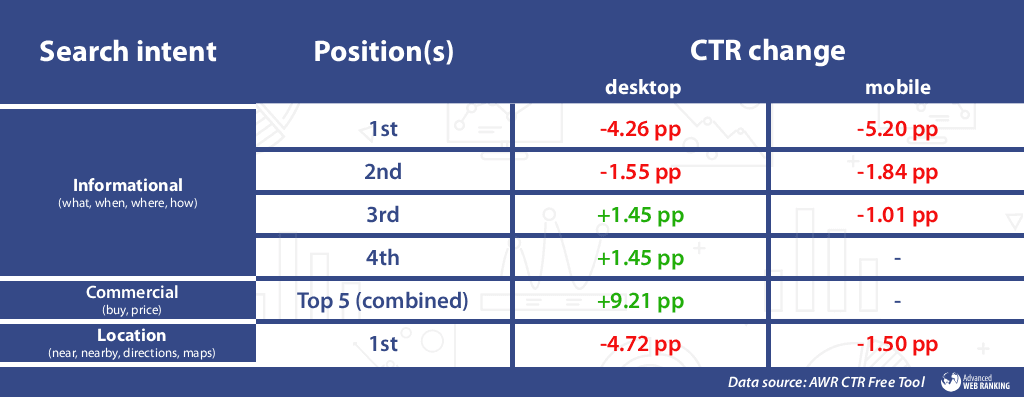
CTR Shifts by Search Intent
For informational queries (containing words such as what, when, where, how, etc.), the CTR values experienced contrasting changes this time. Here, on desktop, the websites ranked in the first two positions witnessed a 5.81 pp combined decline (4.26 pp for those ranked first and 1.55 pp for those ranked second), while those ranked third and fourth registered a 2.90 pp combined growth (equal values of 1.45 pp for each position).
On the other hand, on mobile, the top three websites registered a combined 8.05 pp decline in CTR (5.20 pp for those ranked first, 1.84 pp for those in the second position, and 1.01 pp for those ranked third).
The websites ranked in the first five positions for commercial queries (containing words such as buy, price, etc.) recorded a combined 9.21 pp boost in CTR on desktop, while mobile queries clickthrough rates remained relatively stable.
As for location searches, the websites ranked first recorded drops in CTR on both desktop (4.72 pp) and mobile searches (1.50 pp).
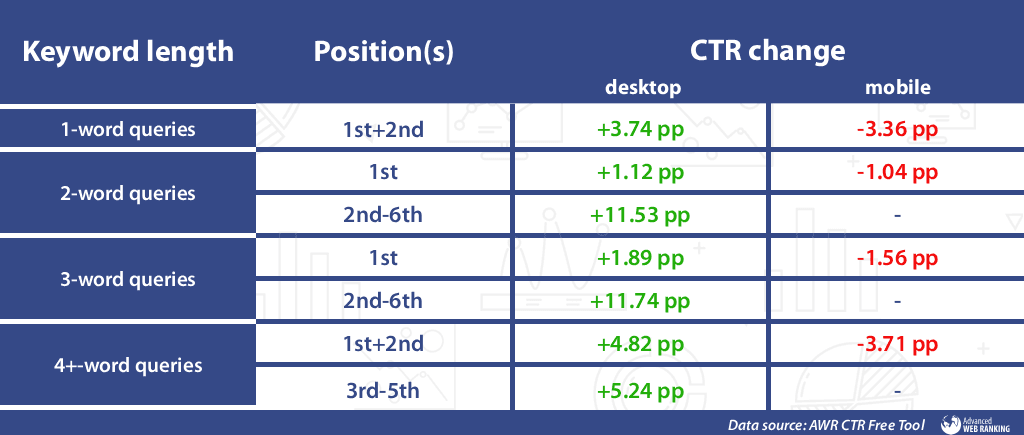
CTR Shifts by Keyword Length
Regardless of the number of words a keyword has, our CTR tool recorded changes on almost all fronts as follows:
for 1-word queries, the websites ranked in the first two positions recorded a combined 3.74 pp increase in CTR on desktop (1.98 pp for those ranked first and 1.76 pp for those ranked second) and a 3.36 pp combined decrease on mobile (2.26 pp for those ranked first and 1.10 pp for those ranked second).
for 2-word queries, the top six websites registered a combined 12.65 pp growth on desktop, while on mobile, only the websites ranked first were affected, experiencing a 1.04 pp drop in CTR.
for 3-word queries, a similar trend to the 2-word queries occurred, with the same positions being affected by the changes. More precisely, the first six websites recorded a combined 13.63 pp boost on desktop, while on mobile, the websites ranked first registered a 1.56 pp loss.
for queries containing 4 or more words, the growth in CTR for the top five positions on desktop equaled a combined 10.06 pp, while on mobile, the websites holding the first two positions suffered a negative impact on their clickthrough rates (3.71 pp combined).
Winning and Losing Industries by CTR Evolution
Integrating search demand data allows us to paint a more complete picture of organic traffic trends across industries, rather than relying solely on rankings.
This approach aligns CTR movements with changes in overall search volume. In essence, traffic grows when CTR and demand rise together, and falls when both decline.
The chapter is organized around demand shifts between quarters.
Note: Following Google’s removal of the num=100 parameter, the impressions declined steeply. Consequently, you’ll notice a downward trend in search demand across most industries.
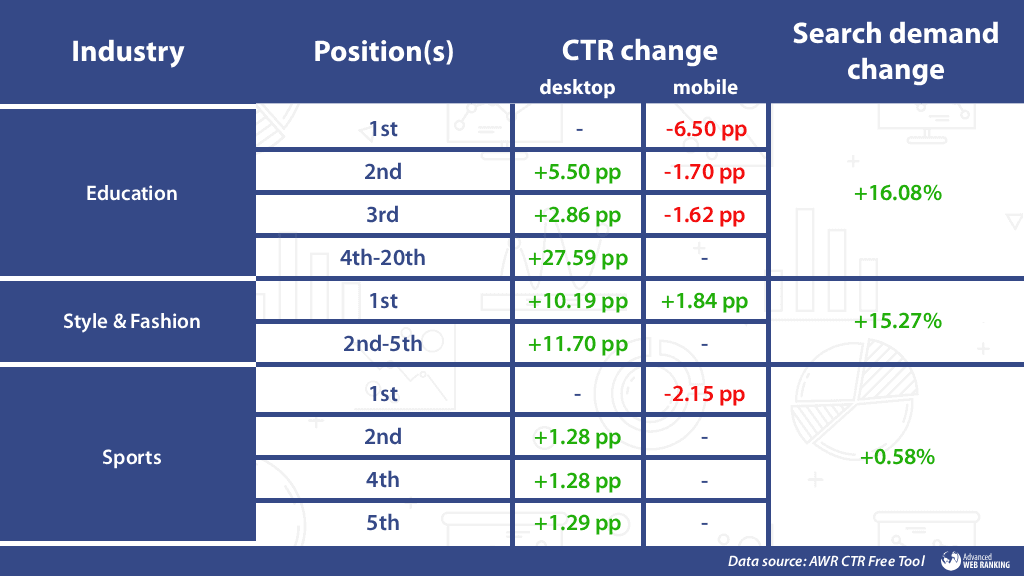
A. Industries where the search demand increased
Let’s start this section in force, with the industry with the highest decline in clickthrough rate for a single position: Education. Here, the CTR for websites ranked first on queries made from mobile devices decreased, on average, by a remarkable 6.50 pp.
The decline affected the websites ranked in the second and third positions on mobile, as well, which recorded a combined 3.32 pp drop in CTR. As for the desktop queries, only the websites ranked first weren’t influenced by the changes, while those in positions 2-20 recorded a combined 35.95 pp growth. Gladly, people’s interest in education grew, resulting in a +16.08% increase in impressions.
Good news for the websites in the Style & Fashion sector, which wraps up the year with growth on all fronts. With a global +15.27% increase in search demand, the websites ranked first on desktop registered the highest growth in CTR for a single position: an impressive 10.19 pp surge.
The growth extended to the websites ranked in the second, third, fourth, and fifth positions on desktop, as well, which recorded a combined 11.70 pp increase in CTR. As for the mobile queries, only the websites ranked first were influenced by the changes, recording a 1.84 pp boost in clickthrough rate.
One last market where the search demand grew slightly (by +0.58%) is Sports. Here, on desktop, the websites ranked second and fourth witnessed an identical CTR boost (1.28 pp), while those ranked in the fifth position experienced a 1.29 pp growth. These gains stood in sharp contrast to mobile performance, where the websites ranked first suffered a 2.15 pp decline in CTR.
Here’s a visual round-up of the changes mentioned in the three industries above:
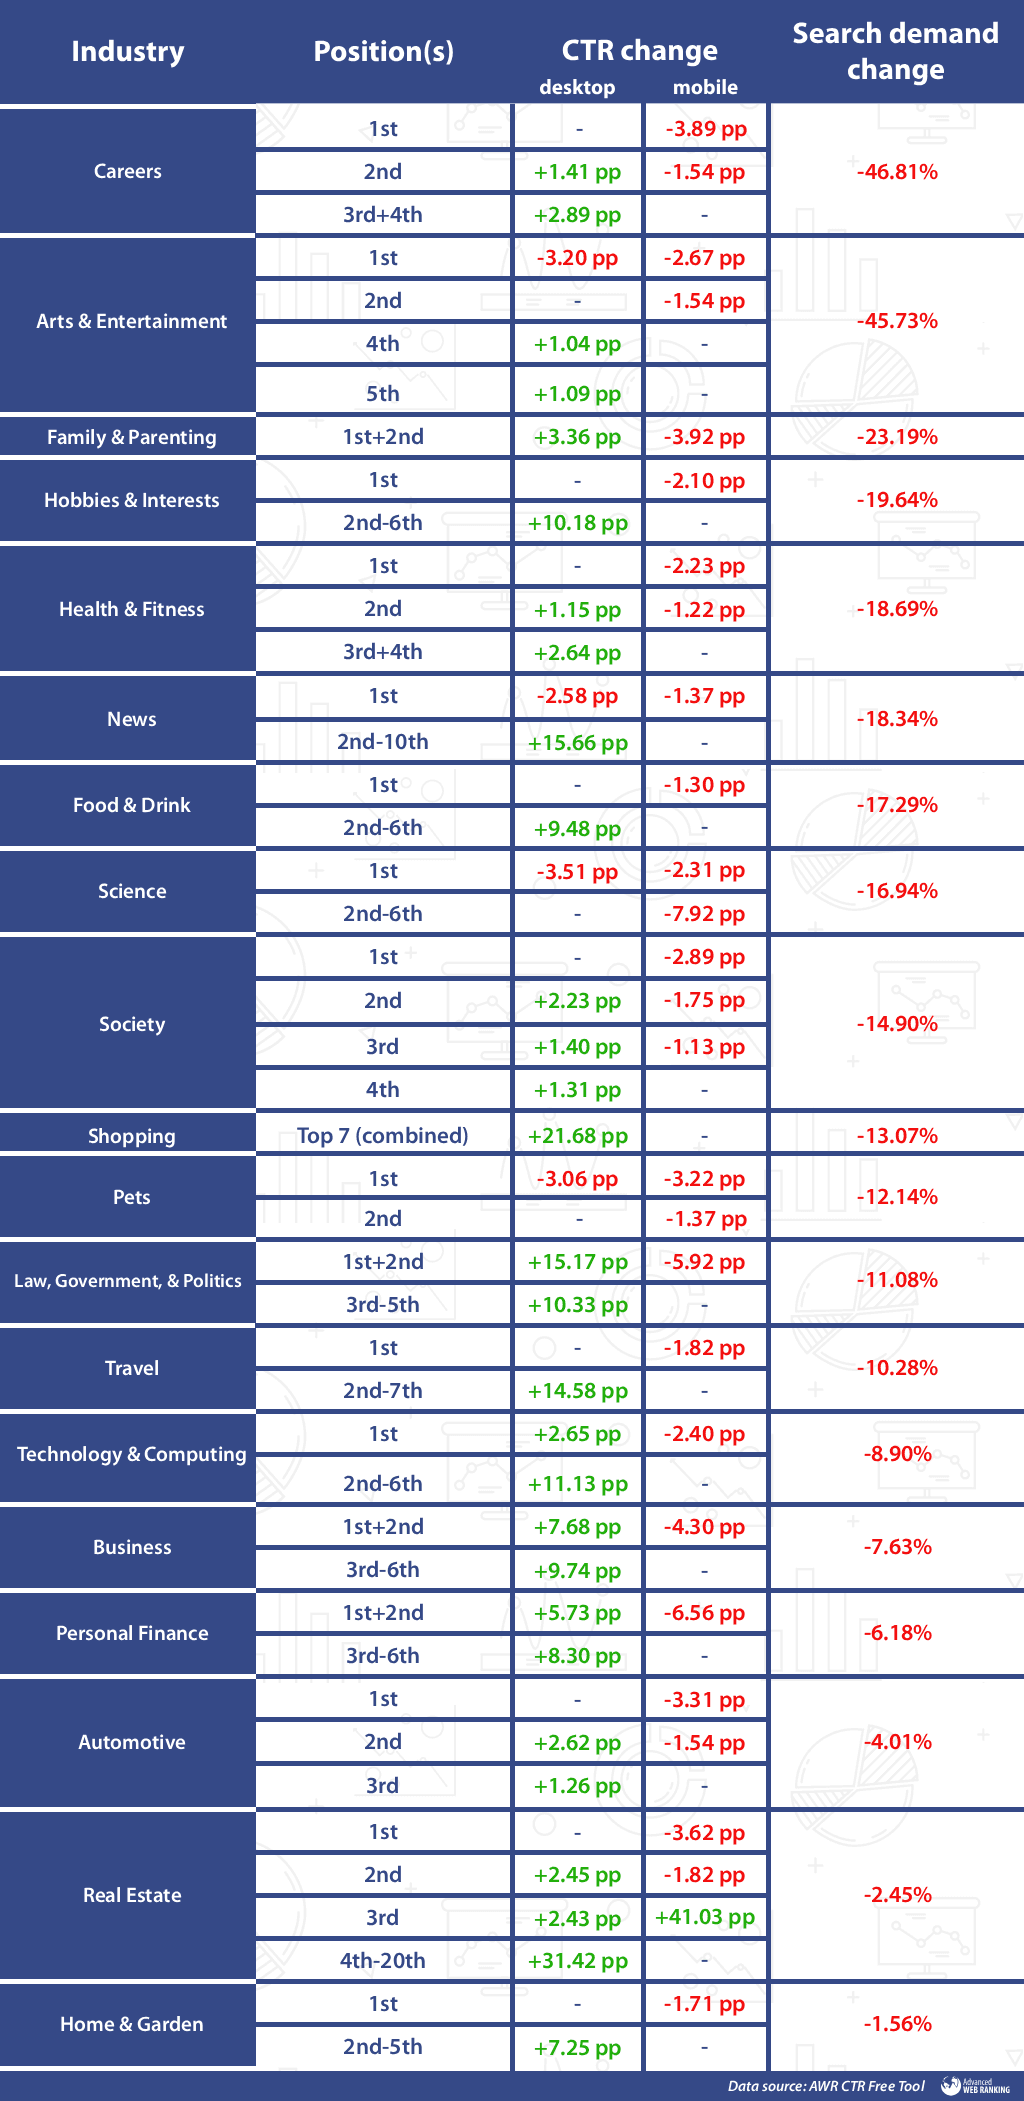
B. Industries that experienced a drop in search demand
Desktop and mobile CTR values went in opposite directions this time around in the Careers market. On desktop, the websites ranked in the second, third, and fourth positions experienced a combined 4.30 pp boost in clickthrough rate. In contrast, the situation was reversed on mobile devices, where the websites ranked in the first two positions witnessed a combined 5.43 pp loss in CTR. Simultaneously, the industry’s overall search demand recorded a steep decrease of 46.81%.
With a -45.73% decline in search demand, the CTR values experienced contrasting changes in the Arts & Entertainment industry. Here, on desktop, the website holding the first position witnessed a 3.20 pp loss, while those in the fourth and fifth positions recorded increases of 1.04 pp and 1.09 pp, respectively. Simultaneously, on mobile, the websites ranked in the first two positions witnessed a combined 4.21 pp loss in CTR.
Despite a 23.19% decrease in search volume for the Family & Parenting category, desktop clickthrough rates for the first two positions improved by 1.20 pp and 2.16 pp, respectively. However, mobile performance told a different story, with a combined 3.92 pp loss for the websites occupying those first two positions (2.40 pp for those ranked first and 1.52 pp for those ranked second).
With no major changes since Q2 2025, the websites ranked in positions 2-6 in the Hobbies & Interests industry recorded a combined 10.18 pp growth in CTR on desktop. On mobile, only the websites ranked first were influenced by the changes, recording a 2.10 pp decline. At the same time, the overall industry’s impressions decreased by -19.64%.
A similar trend occurred in the Health & Fitness industry, where, just like in the Hobbies & Interests market, after a dormant quarter, the clickthrough rate values experienced changes once again. On desktop, the websites ranked in the second, third, and fourth positions experienced a combined 3.79 pp boost in clickthrough rate. In contrast, the situation was reversed on mobile devices, where the websites holding the first two positions witnessed a combined 3.45 pp loss in CTR. Simultaneously, the industry’s overall search demand recorded a decrease of 18.69%
Much like the two sectors mentioned above, Technology & Computing broke out of its dormant state, recording notable changes in user engagement across the top rankings. On desktop, the top six positions experienced a combined 13.78 pp increase, while on mobile, the websites ranked first saw a 2.40 pp decline in CTR. Meanwhile, the aggregated search demand within the industry fell by -8.90%.
Being the industry to record the highest increase in clickthrough rate in the previous quarter, Travel experienced contrasting changes this time. Here, the websites ranked in positions 2-7 on desktop recorded a combined 14.58 pp boost in CTR. As for the mobile queries, only the websites ranked first were influenced by the changes, recording a 1.82 pp decline, while the industry’s overall search demand decreased by -10.28%.
In the News industry, the websites holding the first position saw a 2.58 pp drop in CTR on desktop and a 1.37 pp loss on mobile. The decline on desktop was significantly offset by a massive combined 15.66 pp boost for the websites ranked in positions 2-10. The search demand for this industry recorded losses when compared to the previous quarter (-18.34% to be more precise).
After a dormant quarter, the clickthrough rate values experienced changes once again in the Food & Drink industry. Here, the websites ranked in positions 2-6 on desktop experienced a combined 9.48 pp increase in CTR, while on mobile, only the websites ranked first were affected, registering a 1.30 pp drop. Meanwhile, the search demand for this industry declined by -17.29%.
As for the Science industry, the clickthrough rate for the websites ranked first registered a drop of 3.51 pp on desktop, while on mobile, the websites ranked in the first six positions were influenced by the changes, recording a combined 10.23 pp decline. These changes in CTR, coupled with a decrease of -16.94% in this industry’s overall search demand, might translate into a loss in traffic for those websites affected by the changes.
The Society market also recorded mixed CTR results across devices. On desktop, the websites ranked in the second, third, and fourth positions experienced a combined 4.94 pp boost in clickthrough rate, while on mobile, the websites holding the top three spots witnessed a combined 5.77 pp loss. Alongside these changes, the industry’s overall search demand fell by -14.90%.
The websites ranked in the first seven positions on desktop in the Shopping industry attracted more clicks than in the previous quarter, witnessing a combined 21.68 pp boost in CTR. It remains to be seen if this boost in clickthrough rate can compensate for the decline in traffic resulting from the slight decrease in search demand (-13.07%).
The Pets market recorded losses on all fronts during this fourth quarter. With a global -12.14% decline in search demand, the websites ranked in the first two positions on mobile saw a combined 4.59 pp decline in CTR, while on desktop, the websites ranked first received fewer clicks by 3.06 pp.
A massive ascending trend was recorded in the Law, Government, & Politics market, where the top 5 websites ranked on desktop witnessed a combined 25.50 pp boost in CTR. Conversely, on mobile, the changes affected the first two positions only, which registered a combined 5.92 pp drop in CTR, while the industry’s total search demand decreased by 11.08%.
Good news for the websites ranked in the first six positions on desktop in the Business sector, as they witnessed a growth in CTR by a combined 17.42 pp. On the other hand, the websites ranked in the first two positions on mobile registered a combined 4.30 pp drop in clickthrough rates. During this period, the industry recorded a -7.63% decline in overall search demand.
The Personal Finance market also saw contrasting trends across devices during this period. Here, on desktop, the top six-ranked websites witnessed a 14.03 pp increase in CTR, while on mobile, only the first two positions’ clickthrough rates were affected, experiencing a combined 6.56 pp decline. Simultaneously, during this fourth quarter, the search demand decreased by -6.18%.
In the Automotive industry, while the clickthrough rates for the websites ranked first on desktop remained relatively stable, those for the second and third positions grew by a combined 3.88 pp. On the other hand, the websites ranked first and second on mobile queries experienced a declining trend in CTR (a combined 4.85 pp drop), while this market’s total number of impressions decreased by -4.01%.
Real Estate is the industry with the highest number of positions affected by CTR changes. More precisely, the websites ranked from the second to the twentieth position experienced an impressive combined 36.30 pp boost in CTR on desktop searches. On mobile, the websites ranked in the first two positions registered a negative evolution (a combined -5.44 pp loss), while those ranked in positions 4-20 recorded a remarkable combined 41.03 boost. Over the same period, the overall industry’s search demand contracted slightly, by -2.45%.
Last but not least, with an almost insignificant change in search demand (-1.56%), the Home & Garden market recorded changes on both desktop and mobile devices. The websites ranked in positions 2-5 on desktop registered a combined 7.25 pp growth, while on mobile, the changes affected the websites ranked first only, which witnessed a 1.71 pp decline.
Here’s a graphical summary of all the changes presented above:
That’s it for…the fourth quarter
The last quarter of the year’s report highlighted an atypical trend, with desktop CTR rising and mobile CTR dropping. It remains to be seen if this represents a lasting shift or a seasonal outlier.
Industry trends provide a baseline, but your site’s data is unique. Generic benchmarks can’t account for your specific SERP landscape. Advanced Web Ranking solves this by correlating pixel depth with CTR, revealing how your visual position (not just your rank) dictates traffic.
Ready to benchmark your true CTR? Try AWR for free and see the difference.
Stay tuned for our Q1 2026 analysis, where we’ll explore the evolving trends in clickthrough rates. Until then, stay safe and healthy!

Article by
Dan Popa
Dan Popa is an Online Marketing Strategist at Caphyon. He is passionate about both Online and Offline Marketing and he's always looking for new ways of applying the basic principles of marketing in the fast-evolving SEO field. He's always in the mood to chat about new creative ideas for campaigns, so you can find him on Twitter.


