

There’s been a lot of controversy in the SEO industry lately about the traffic the websites receive from search and the surge of AI Overviews. On one hand, Google states that ‘AI in Search is driving more queries and higher quality clicks’, while the hands-on experience categorically contradicts it (e.g., Aleyda’s well-documented take on this matter).
We’ll try to shed some light on how the organic clicks fluctuated in Q2 when compared against the Q1 values, by analyzing the data provided by our free Google CTR tool. In addition, we’ll take a look at how the AI Overviews evolved on a global scale between these quarters.
When running a campaign, for example, on TikTok, and seeing the branded traffic and the revenue increasing, we can do correlation (Gerry White has a nice way to explain this attribution model in one of our podcast episodes). However, correlation doesn’t necessarily mean causation, so we'll focus on measuring the shifts (yes, surprisingly, there are some websites gaining traffic, too) in clickthrough rates across various industries and query types. This analysis is based on data gathered from thousands of sites and millions of keywords.
Methodology
We calculated the CTR averages for each position for Q2 2025 (April-June interval) and compared them against the ones retrieved for Q1 2025 (January-March). All significant changes were included in this analysis and expressed as percentage points (pp).
The data set is international and comprises all the available markets, such as the US, UK, etc.
Since clicks and impressions go hand in hand when projecting estimated traffic, we also correlated these CTR changes with search demand data at an industry level.
For each industry, we determined the average number of impressions in Q2 2025, compared it to Q1 2025, and expressed the difference as a percentage.
CTR Shifts Across All Searches
When averaging CTRs across all industries, the first two positions’ clickthrough rates for desktop queries decreased by a combined 3.75 pp (2.16 pp for those ranked first and 1.58 pp for those ranked second) compared to the previous quarter, while mobile query CTRs remained relatively stable.
Simultaneously, the analysis of data from the free AIO tool reveals a strong upward shift in the frequency of AI Overviews in Google search results during Q2, growing by 11.90 percentage points relative to Q1 (from 34.32% to 46.22%).
Although other factors like featured snippets and ad packs can also cause CTR swings, AI Overviews remain a key variable that shouldn’t be overlooked.
With AI Overviews becoming more prevalent, clickthrough rates for organic listings may be taking a hit, as traditional content is pushed further down the page by AI-generated summaries.

Pro Tip
Understanding SERP dynamics requires more than just tracking keyword rankings. Advanced Web Ranking's ‘pixel depth’ metric shows how far down the page your listing appears. Try it out for free!
CTR Shifts in Branded vs. Unbranded Queries
Counterintuitively, the branded queries were more heavily impacted than the unbranded ones. More precisely, the first three positions on desktop for searches mentioning a specific brand or business name registered a combined 5.81 pp drop in CTR (2.16 pp for those ranked first, 1.58 pp for those in the second position, and 1.10 pp for those ranked third).
As for the unbranded queries, the changes affected the websites ranked in the first two positions only, which experienced a combined 3.57 pp drop in CTR on desktop (2.01 pp for those ranked first and 1.56 pp for those ranked second).

CTR Shifts by Search Intent
The websites ranked in the first three positions for informational queries (containing words such as what, when, where, how, etc.) recorded a combined 6.25 pp decrease in CTR on desktop. On mobile, the decline affected the websites ranked second only, which witnessed a 1.02 pp drop in clickthrough rate.
A similar trend occurred for commercial searches (containing words such as buy, price, etc.), where the declining trend in CTR affected multiple positions on desktop and a single one on mobile. More exactly, the websites ranked in the first four positions on desktop recorded an even more impressive combined drop of 10.56 pp in CTR. On the other hand, the decline affected the websites ranked second on mobile, as well, which registered a 1.63 pp drop in CTR.
As for location queries (containing words such as near, from, nearby, directions, maps, etc.), the CTR values experienced contrasting changes based on devices. Here, the websites ranked first recorded a 1.91 pp decrease in CTR on desktop, while on mobile, the growth equaled a solid 4.63 pp.

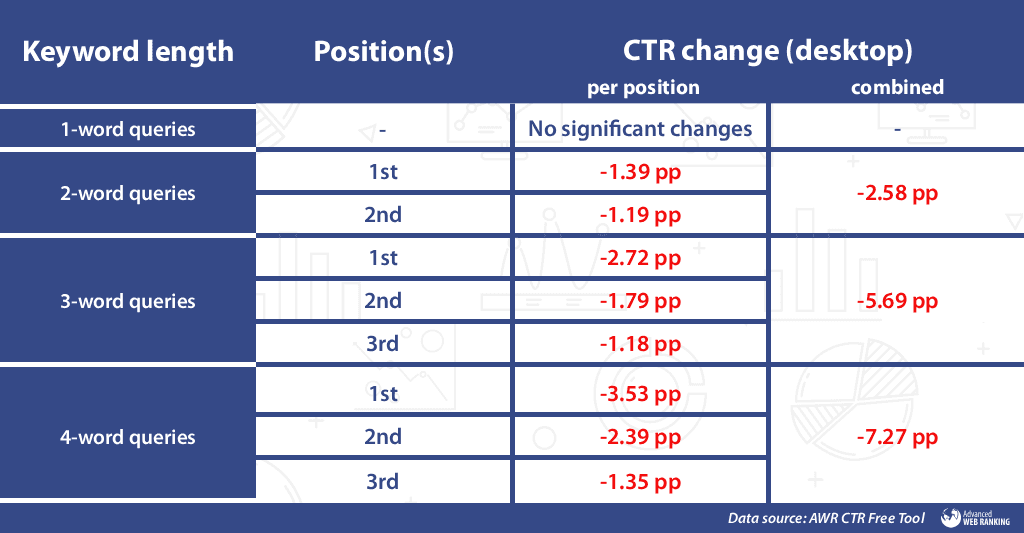
CTR Shifts by Keyword Length
Based on the number of words a keyword has, apart from the 1-word queries, our CTR tool recorded drops on all fronts on desktop queries as follows:
for 2-word queries, the websites ranked in the first two positions recorded a combined 2.58 pp decrease in CTR (1.39 pp for those ranked first and 1.19 pp for those ranked second)
for 3-word queries, the top three websites ranked registered a combined 5.69 pp decline (2.72 pp for those ranked first, 1.79 pp for those in the second position, and 1.18 pp for those ranked third)
for queries containing 4 or more words, the drop in CTR for the top three positions equaled a combined 7.27 pp (3.53 pp for those ranked first, 2.39 pp for those ranked second, and 1.35 pp for those in the third position)
Winning and Losing Industries by CTR Evolution
By including search demand data in our analysis, we can gain a deeper understanding of why organic traffic changes across different industries, even when a website's search engine rankings remain the same. This approach allows us to connect fluctuations in clickthrough rates with shifts in industry search volume.
For example, a website is likely to see an increase in organic traffic if it experiences both a higher CTR and an increase in overall search interest within its industry. In contrast, a drop in traffic can be caused by a combination of declining CTRs and lower search demand.
This chapter is divided into two sections, each focusing on how search demand evolved between quarters.
A. Industries where the search demand increased
The websites ranked first on desktop in the Sports industry attracted fewer clicks than in the previous quarter, witnessing a 1.81 pp decline in CTR. It remains to be seen if the major boost in search demand (+64.06%) can compensate for the decline in traffic resulting from a lower clickthrough rate.
In the Pets industry, surprisingly, the websites ranked first weren’t quite influenced by the changes. However, those ranked in the second position registered a 1.20 pp drop in CTR on desktop, while the market’s search demand increased by +9.88%.
And now let’s jump to the industry with the highest increase in clickthrough rate for a single position: Law, Government, & Politics. Here, the CTR for websites ranked first on queries made from mobile devices grew, on average, by 2.20 pp.

On the other hand, the websites ranked in the second position on mobile recorded a 1.20 pp drop in CTR.
Websites ranked in the first two positions on desktop in the Law, Government, & Politics industry were also affected, seeing a combined 3.74 pp drop (2.24 pp for those ranked first, and 1.50 pp for those ranked second). On a more positive note, this market registered a +6.68% growth in search demand.
Desktop and mobile CTR values went in opposite directions this time around in the Business category, for the websites at the top. Here, on desktop, the websites ranked in the first two positions witnessed a combined 4.22 pp loss, while on mobile, the websites ranked first experienced a 1.41 pp boost in CTR. Concurrently, the number of impressions for this industry increased by +6.03%.
As unexpected as it may seem, Health is the industry with the highest frequency of AI Overviews in SERPs.
This high AI Overviews prominence might be a potential reason why the clickthrough rates for the top-ranked websites dropped. More precisely, the first three positions on desktop registered a combined 6.55 pp loss in CTR (3.38 pp for those ranked first, 1.94 pp for those ranked second, and 1.23 pp for those ranked in the third position). Meanwhile, the overall industry’s search demand increased slightly, by +1.26%.
In a recent episode of The Search Session podcast, Gianluca and Judith discuss AIOs in Health. Check it out!
Here’s a visual round-up of the changes mentioned in the five industries above:

B. Industries that experienced a drop in search demand
The highest decrease in impressions (-81.03%) was recorded by the Careers industry. As for the CTR values, the websites ranked in the first three positions experienced a combined 5.92 pp loss on desktop (2.77 pp for those ranked first, 1.99 pp for those ranked second, and 1.16 pp for those ranked third). On a more positive note, the websites ranked first on mobile queries witnessed a 1.87 pp growth in CTR.
It’s time to turn our attention to the second quarter’s highest decrease in clickthrough rate for a single position: the Family & Parenting category. Here, the clickthrough rate for websites ranked first on desktop declined, on average, by a remarkable 6.81pp.

The decline affected the websites ranked in the second, third, and fourth positions on desktop, as well, which recorded a combined 7.07 pp drop in CTR. As for the mobile queries, only the websites ranked second were influenced by the changes, recording a 1.27 pp decline, while the industry’s overall search demand decreased by -37.26%.
Good news for the websites ranked first in the Arts & Entertainment market, as they witnessed a growth in CTR by 1.35 pp on desktop and by 1.61 pp on mobile searches. On the other hand, the websites ranked second experienced a 1.08 pp drop in CTR on desktop searches only. Meanwhile, the search demand for this industry declined by -36.72%.
While the websites in the first position in the News industry were surprisingly unaffected by the changes, those ranked in the second position on desktop registered a 1.91 pp decline in CTR. Concurrently, the number of impressions for this industry decreased by -24.85%.
With no major changes since Q4 2024, the websites ranked in the first two positions in the Food & Drink industry recorded a combined 3.53 pp decline in CTR on desktop (2.03 pp for those ranked first and 1.50 pp for those ranked in the second position). At the same time, the overall industry’s impressions decreased by -19.98%.
Personal Finance recorded a decline of -18.46% in search demand. Here, the clickthrough rates for the top two websites registered a combined decline of 5.85 pp on desktop (3.90 pp for those ranked first and 1.95 pp for those ranked second). Meanwhile, the websites ranked first on mobile queries can consider themselves quite fortunate this quarter, increasing their CTR by 1.26 pp.
Disappointingly, people’s interest in Education dropped, resulting in a -18.12% decline in impressions. Simultaneously, the websites ranked in the first three positions on desktop witnessed a combined 5.94 pp decrease in CTR (2.39 pp for those ranked first, 2.45 pp for those ranked second, and 1.10 pp for those ranked in the third position).
As for the Society category, the clickthrough rates for the top three websites registered a combined drop of 7.97 pp on desktop, while on mobile, only the websites ranked in the second position were influenced by the changes, recording a 1.25 pp decline. These changes in CTR, coupled with a decrease of -16.60% in this industry’s overall search demand, might translate into a loss in traffic for those websites affected by the changes.
The websites ranked in the first two positions in the Hobbies & Interests industry experienced a combined 3.60 pp loss in CTR on desktop. At the same time, the total number of impressions decreased by -12.01%.
A similar trend occurred in the Technology & Computing industry, where, just like in the Hobbies & Interests market, the very same websites were affected negatively, while the impressions dropped. Here, the websites ranked in the first two positions on desktop recorded a combined 2.48 pp decline in CTR, while the industry’s search demand decreased by -9.03%.
The Automotive industry recorded losses on all fronts during this second quarter. With a global -4.00% decrease in search demand, the websites ranked in the first two positions on desktop saw a combined 4.39 pp decline in CTR, while on mobile, the websites ranked in the second position received fewer clicks by 1.07 pp.
In the Science industry, the top four websites experienced a combined 9.59 pp decline in CTR on mobile. The declining trend was even steeper on desktop, where the website ranked in the first four positions witnessed a combined 13.86 pp drop in CTR. Simultaneously, the number of impressions for this market dropped slightly, by -3.49%.
In the previous quarter’s analysis, the Real Estate category was associated with the highest increase in clickthrough rate of that period. Tables turned, and the industry experienced a combined decline of 3.98 pp in CTR for the websites ranked in the first two positions on desktop. At the same time, the impressions for this industry recorded a slight drop of -2.37%.
After two dormant quarters, the clickthrough rate values experienced changes once again in the Home & Garden market. Here, the websites ranked in the first three positions recorded a combined drop in CTR of 5.04 pp on desktop, while the industry’s global search demand declined by -2.09%.
Last but not least, with a decline of -4.70% in search demand, the Travel industry recorded a 1.71 pp decrease in CTR for the websites ranked first on desktop devices only.
Here’s a graphical summary of all the changes presented above:

That’s it for…the second quarter
This quarter’s report highlighted significant CTR shifts impacting all intent types, both branded and unbranded searches, multi-word queries, as well as significant changes across twenty different industries. The prevailing trend showed a negative impact for most desktop queries, while only a few websites experienced positive CTR shifts.
Finally, yet importantly, this analysis suggested a potential link between the rising presence of AI Overviews and declining CTRs. This underscores the importance of tracking pixel position alongside AIO rankings, SERP layout and click data to gain a complete understanding of SERP dynamics.
Stay tuned for our Q3 2025 analysis, which will offer further insights. Until then, stay safe and healthy!

Article by
Dan Popa
Dan Popa is an Online Marketing Strategist at Caphyon. He is passionate about both Online and Offline Marketing and he's always looking for new ways of applying the basic principles of marketing in the fast-evolving SEO field. He's always in the mood to chat about new creative ideas for campaigns, so you can find him on Twitter.


