
With widespread concerns over the increasing dominance of AI Overviews in SERPs, the traffic landscape can look grim. However, this broad trend doesn't tell the full story. We've found that for some query types and industries, the websites ranked in certain positions resisted the decline and actually grew in CTR, while, as expected, others faced significant losses.
TLDR
The websites ranked in positions 2-6 on desktop for branded searches recorded a combined 8.71 pp boost in CTR.
4+-word queries were the only ones with steady CTR.
There were no less than 18 industries affected by the changes.
CTR fluctuations were recorded on all search intent types.
Arts & Entertainment is the industry with the highest decrease in clickthrough rate for a single position (websites ranked first on desktop dropped by 5.13 pp in CTR).
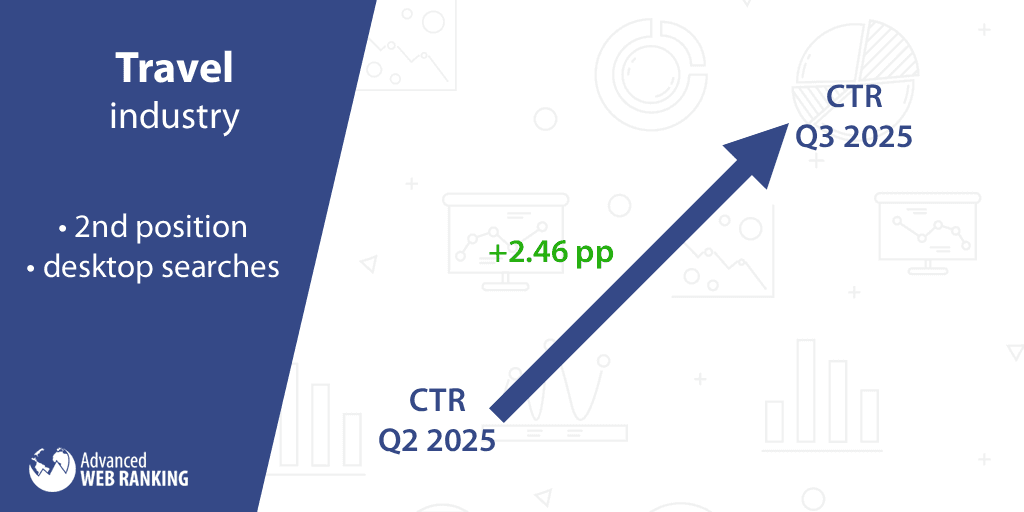
The highest increase in CTR for a single position was recorded in the Travel industry (the CTR for the websites ranked second on desktop grew by 2.46 pp).
In this analysis, we'll dive deeper into the data to see precisely how the Google CTR values shaped up in this year’s third quarter. This study uses an extensive dataset drawn from thousands of sites and millions of keywords.
Methodology
We calculated the CTR averages for each position for Q3 2025 (July-September interval) and compared them against the ones retrieved for Q2 2025 (April-June). All significant changes were included in this analysis and expressed as percentage points (pp).
The data set is international and comprises all the available markets, such as the US, UK, etc.
Since clicks and impressions go hand in hand when projecting estimated traffic, we also correlated these CTR changes with search demand data at an industry level.
For each industry, we determined the average number of impressions in Q3 2025, compared it to Q2 2025, and expressed the difference as a percentage.
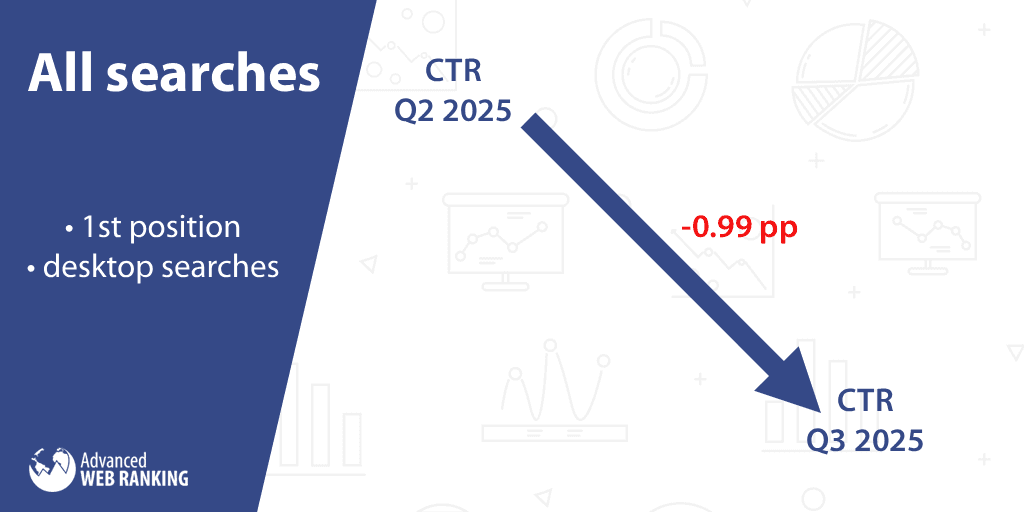
CTR Shifts Across All Searches
When averaging CTRs across all industries, first-position clickthrough rates for desktop queries decreased by almost an entire percentage point (0.99 pp) compared to the previous quarter, while mobile query CTRs remained relatively stable.
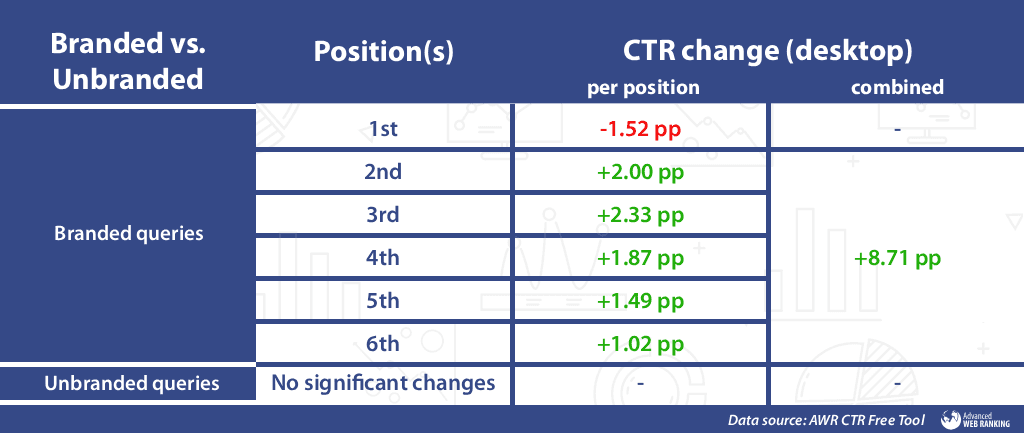
CTR Shifts in Branded vs. Unbranded Queries
Although the CTR for websites ranked in unbranded queries remained unchanged, significant shifts were observed exclusively in branded queries on desktop searches. Specifically, for searches containing particular brand or business names, the websites ranked first on desktop witnessed a 1.52 percentage point drop in CTR.
On the other hand, the websites ranked in positions 2-6 recorded a combined 8.71 pp boost in CTR (2.00 pp for those ranked second, 2.33 pp for those ranked third, 1.87 pp for those ranked fourth, 1.49 pp for those ranked in the fifth position, and 1.02 pp for those ranked sixth).
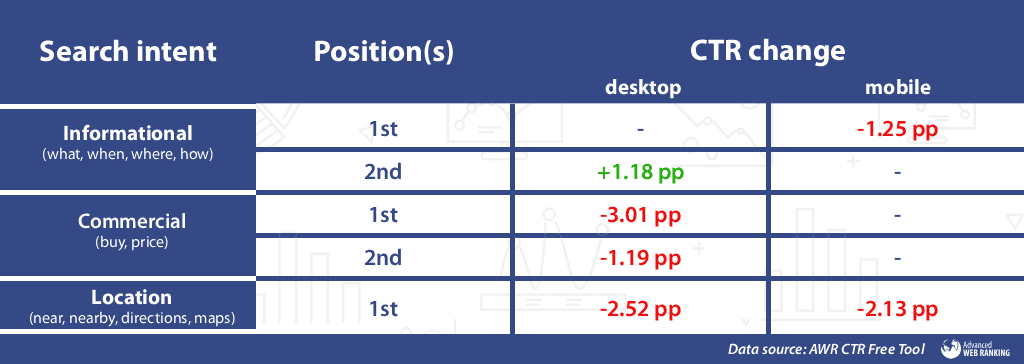
CTR Shifts by Search Intent
For informational queries (containing words such as what, when, where, how, etc.), the CTR values experienced contrasting changes based on devices. Here, the websites ranked second recorded a 1.18 pp increase in CTR on desktop, while on mobile, the websites ranked first were the ones affected, witnessing a 1.25 pp drop.
The websites ranked in the first two positions for commercial queries (containing words such as buy, price, etc.) recorded a combined 4.20 pp decrease in CTR on desktop (3.01 pp for those ranked first and 1.19 pp for those ranked second).
As for location searches, the websites ranked first recorded drops in CTR on both desktop (2.52 pp) and mobile queries (2.13 pp).
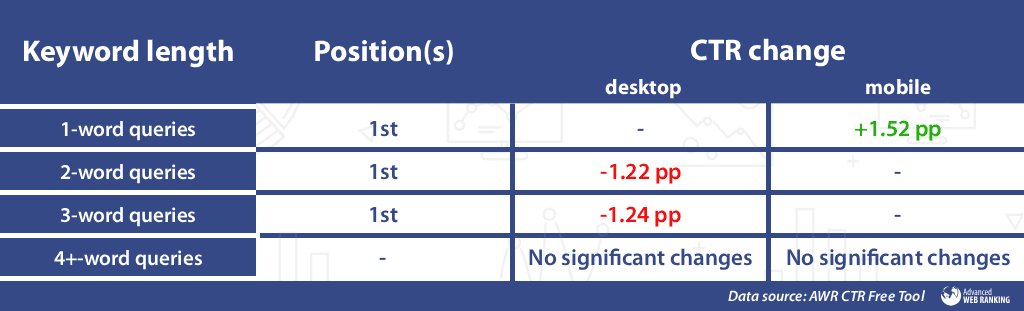
CTR Shifts by Keyword Length
The websites holding the first-place rank on desktop were the ones suffering a negative impact on their clickthrough rates. Specifically, their CTR declined by 1.22 pp for 2-word searches and by 1.24 pp for queries containing three words.
On the other hand, on mobile, the changes affected the websites ranked for shorter queries (1-word only), which recorded a 1.52 pp increase in CTR for the websites ranked first.
Winning and Losing Industries by CTR Evolution
By integrating search demand data, we offer a more complete picture of organic traffic changes across industries, overriding the common assumption that rankings alone tell the whole story.
This is accomplished by linking CTR shifts to industry search volume movements. Simply put: traffic goes up when a higher CTR aligns with increased search interest, and traffic falls when decreasing CTRs meet lower demand.
This chapter will be organized into two sections, corresponding to the shifts in search demand between the quarters.
A. Industries that experienced an increase in search demand
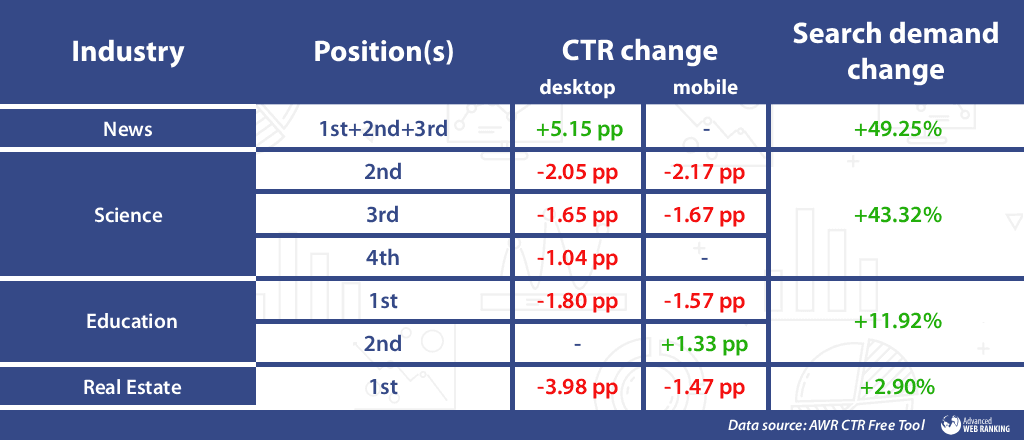
The websites ranked in the first three positions in the News industry experienced a combined 5.15 pp increase in CTR on desktop (1.43 pp for those ranked first, 2.32 pp for those ranked second, and 1.40 pp for those ranked in the third position).
Coupled with a growth of +49.25% in search demand, it’s highly probable that the websites ranked in those three positions noticed a spike in organic traffic.
The Science industry got on the downward slope this time. Here, the websites ranked from the second to the fourth position experienced a combined 4.74 pp decrease in CTR on desktop searches (2.05 pp for those ranked second, 1.65 pp for those in the third position, and 1.04 pp for those ranked fourth). The drop in CTR was consistent on mobile, as well, where the websites ranked second lost, on average, 2.17 pp, while those ranked third registered a 1.67 pp decline.
Despite recording drops in clickthrough rates, there’s still a glimmer of hope for the websites in this market since the total number of impressions grew by +43.32%.
Gladly, while people’s interest in Education grew in Q3, being translated into a +11.92% increase in impressions, the CTR values experienced contrasting changes this time. Here, on mobile, the websites ranked first witnessed a 1.57 pp loss, and those ranked in the second position registered a 1.33 pp growth. As for the desktop queries, only the websites ranked first were affected, experiencing a 1.80 decline in CTR.
One last market where the search demand grew slightly (by +2.90%) is Real Estate. Nevertheless, the CTR values went in the opposite direction, at least for the websites ranked first, which registered a 3.98 pp drop on desktop and a 1.47 pp decrease on mobile queries.
Here’s a visual round-up of the CTR evolution in all four industries mentioned above:
B. Industries where the search demand dropped
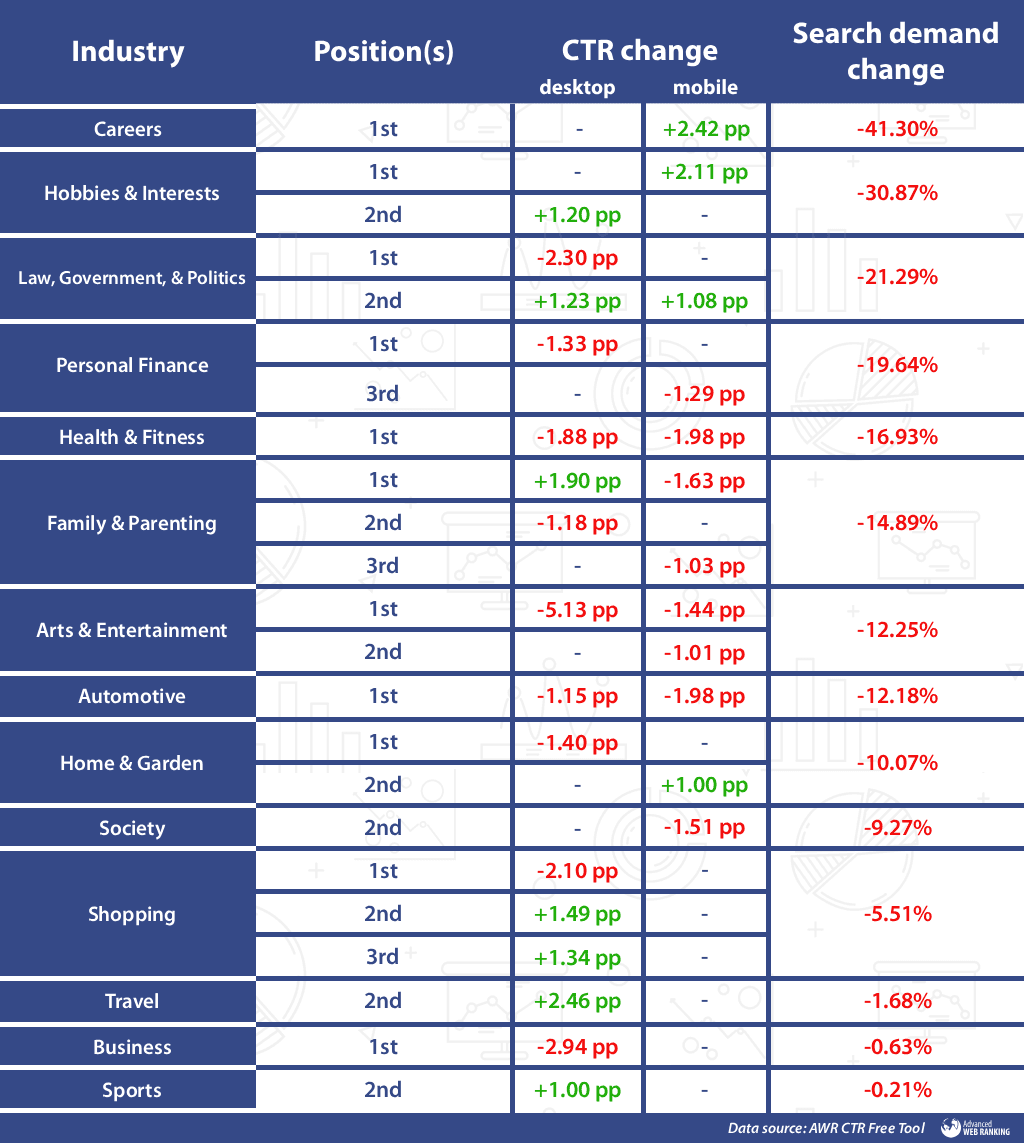
The Careers industry continued on a descending trend since the previous quarter, when it was proclaimed the market with the highest decline in impressions. In contrast to a -41.30% drop in search demand, the CTR for the websites ranked first on mobile experienced a 2.42 pp growth in CTR.
The clickthrough rate and search demand values went in opposite directions this time around in the Hobbies & Interests industry. The CTR for the websites ranked second increased by 1.20 pp on desktop, while on mobile, the growth affected the websites ranked first, which recorded a 2.11 pp boost.
Nevertheless, the industry’s overall search demand went in the opposite direction, decreasing by -30.87%.
Being the industry to record the highest increase in clickthrough rate in the previous quarter, Law, Government, & Politics experienced contrasting changes this time. Here, on desktop, the websites ranked first witnessed a 2.30 pp loss, while those ranked in the second position experienced a 1.23 pp growth. Surprisingly, on mobile, the websites ranked first weren’t influenced by the changes, while those ranked in the second position registered a 1.08 pp increase in CTR. Simultaneously, during this third quarter, the search demand decreased by -21.29%
As for the Personal Finance market, the clickthrough rate for the websites ranked first registered a drop of 1.33 pp on desktop, while on mobile, the websites ranked in the third position were influenced by the changes, recording a 1.29 pp decline. These changes in CTR, coupled with a decrease of -19.64% in this industry’s overall search demand, might translate into a loss in traffic for those websites affected by the changes.
With no major changes since Q1, the websites ranked first in the Health & Fitness industry recorded drops in CTR on both desktop (1.88 pp) and mobile queries (1.98 pp). The search demand for this industry also recorded losses when compared to the previous quarter (-16.93% to be more precise).
The websites ranked first on desktop in the Family & Parenting industry can consider themselves quite fortunate this quarter, increasing their CTR by 1.90 pp. Meanwhile, the websites ranked second on desktop registered a 1.18 pp loss, while on mobile, the clickthrough rates for the websites ranked first and third registered a decline of 1.63 pp and 1.03 pp, respectively.
Simultaneously, the number of impressions for this market dropped by -14.89%.
And now let’s jump to the industry with the highest decrease in clickthrough rate for a single position: Arts & Entertainment. Here, the CTR for websites ranked first on desktop dropped, on average, by a remarkable 5.13 pp.

On the other hand, the decline affected the websites ranked in the first two positions on mobile, as well, which recorded a combined 2.45 pp drop in CTR, while the industry’s overall search demand decreased by -12.25%.
The Automotive industry recorded losses on all fronts during this second quarter. With a global -12.18% decrease in search demand, websites ranked first recorded a 1.15 pp decline on desktop and a 1.98 pp drop on searches made from mobile devices.
Desktop and mobile CTR values went in opposite directions this time around in the Home & Garden market, for the websites at the top. Here, on desktop, the websites ranked first witnessed a 1.40 pp loss, while on mobile, the websites ranked second experienced a 1.00 pp boost in CTR. Concurrently, the number of impressions for this industry decreased by -10.07%.
In the Society category, surprisingly, the websites ranked first weren’t quite influenced by the changes. However, those ranked in the second position registered a 1.51 pp drop in CTR on mobile, while the market’s search demand declined by -9.27%.
After two dormant quarters, the clickthrough rate values experienced changes once again in the Shopping industry. Here, the websites ranked first on desktop registered a 2.10 pp drop, while those ranked second and third witnessed a combined 2.83 pp boost in CTR (1.49 pp for those ranked second and 1.34 pp for those ranked third). Meanwhile, the search demand for this industry declined by -5.51%.
It’s time to turn our attention to the highest growth in CTR for a single position: the Travel industry. Here, the clickthrough rate for websites ranked second on queries made from desktop devices grew, on average, by 2.46 pp, while people’s interest in traveling decreased slightly, by -1.68%.
The websites ranked second on desktop in the Sports industry attracted more clicks than in the previous quarter, witnessing a 1.00 pp increase in CTR. It remains to be seen if this boost in clickthrough rate can compensate for the decline in traffic resulting from the almost insignificant decrease in search demand (-0.21%).
Last but not least, with a slight decline of -0.63% in search demand, the Business industry recorded a 2.94 pp decrease in CTR for the websites ranked first on desktop devices only.
Here’s a visual recap of the changes mentioned above:
That’s it for…the third quarter
Despite the seemingly gloomy outlook, marked by decreasing organic traffic, this quarter’s report highlighted even positive outcomes for some SERP listings. The CTR shifts impacted the branded searches, all intent types, the queries containing up to three words, and no less than eighteen industries.
While industry-wide CTR trends reveal important patterns, remember that your specific performance may vary significantly.
There's no one-size-fits-all benchmark - to truly understand your organic visibility, you need to paint the big picture.
Advanced Web Ranking lets you track the pixel depth of your ranked pages—showing how far down the SERP your links appear—and ties that data directly to your CTR performance.
Instead of relying solely on broad industry averages, you can see exactly how SERP layout changes affect your click-through rates and paint a complete picture of your search visibility.
Ready to benchmark your true CTR? Try AWR for free and see the difference.
Stay tuned for our Q4 2025 analysis, which will offer further insights into the volatile clickthrough rates evolution. Until then, stay safe and healthy!

Article by
Dan Popa
Dan Popa is an Online Marketing Strategist at Caphyon. He is passionate about both Online and Offline Marketing and he's always looking for new ways of applying the basic principles of marketing in the fast-evolving SEO field. He's always in the mood to chat about new creative ideas for campaigns, so you can find him on Twitter.


