
Integrating AWR Keyword Ranking data in Google Looker Studio
A few months ago, we started a new and exciting project at AWR, addressing the integration with other reporting solutions.
We focused on getting visibility metrics to Google Looker Studio reports in the first release, offering a clear overview of how your websites and keyword groups perform in terms of search visibility, click share, estimated visits, and more.

This time, we come back with a Data Studio connector version that brings more granular data for tracking keyword positions, identifying best performing terms and URLs, and getting insights on search demand shifts.
Big “Thank you!” to all our customers who were part of the User Test, and to our integrations lead and his team =).
Here’s what you will learn:
AWR Data Source Setup
Keywords and Landing Pages Widget Models
Rank Performance Audit Report
Now, let’s take a quick look at how you can set up the Data Source to get the keyword positions.
AWR Data Source Setup
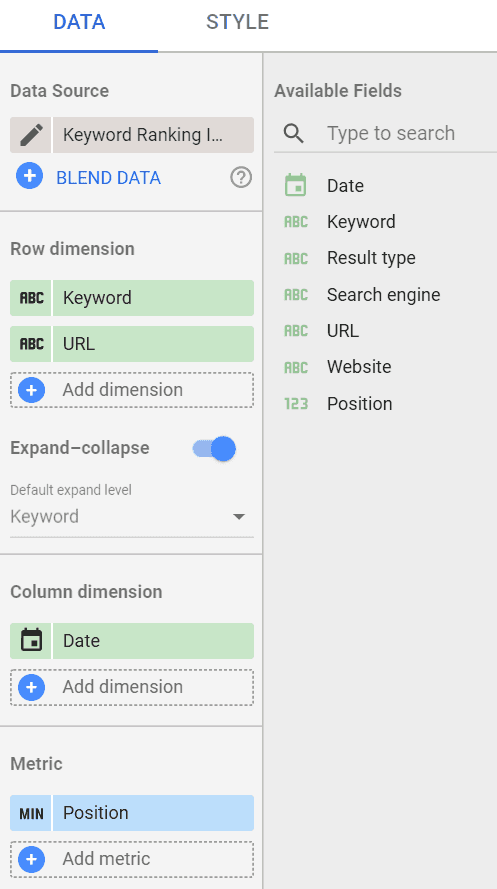
When creating a data source for AWR ranking data, you can choose between two Keyword Ranking report types:
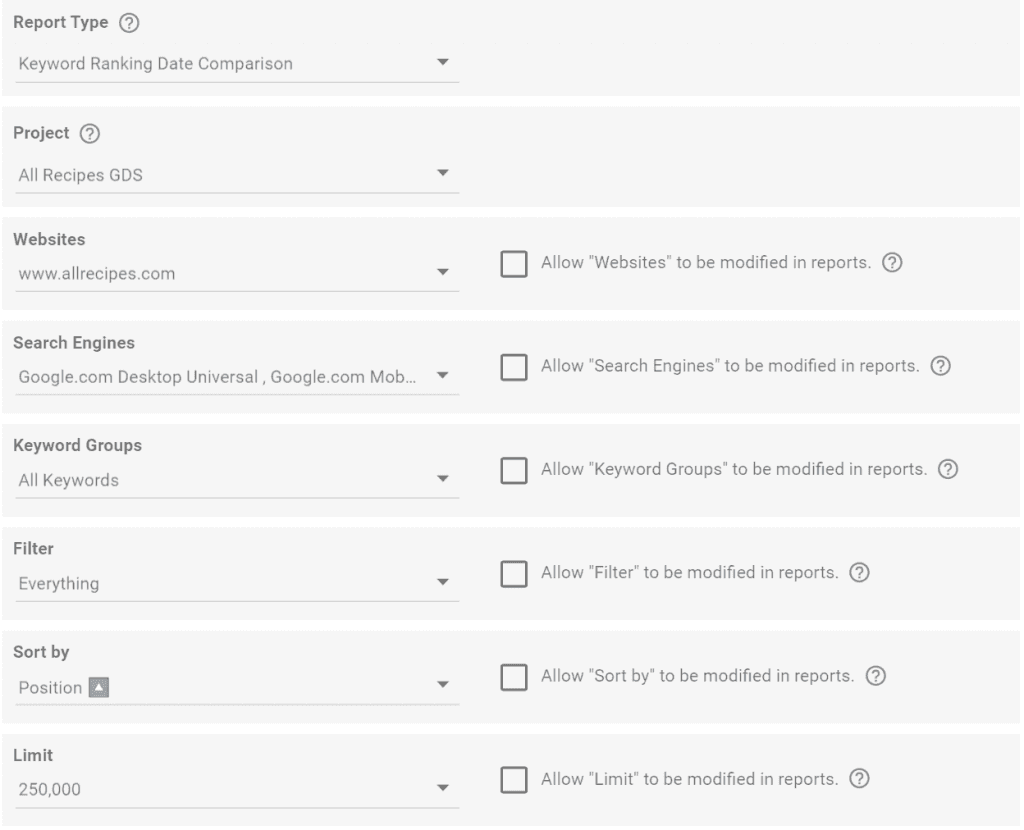
1. Keyword Ranking Date Comparison
I recommend this report for scorecard and table report widgets, where you can compare the keyword positions and search volumes recorded for a particular date, to a date in the past.
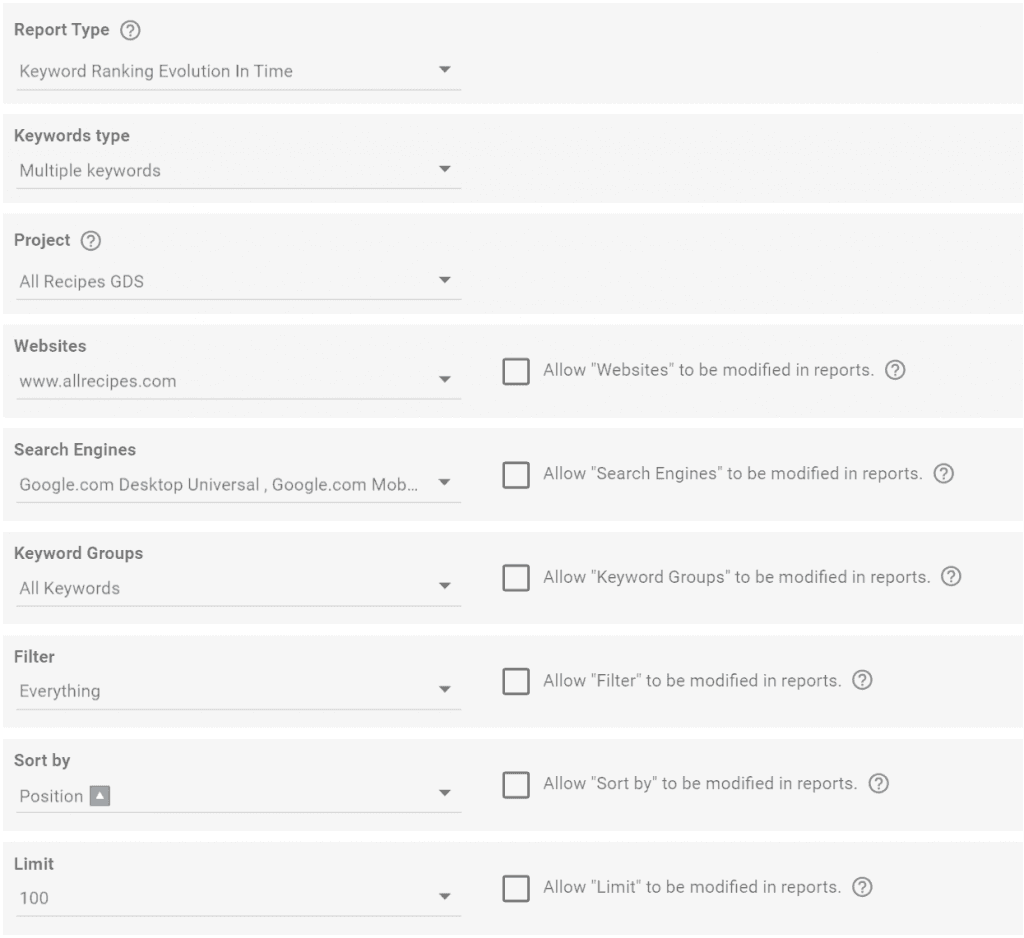
2. Keyword Ranking Evolution In Time
Use this report for table and chart widgets, where you can list keyword positions side by side across multiple dates.
You can find the Metrics and Dimensions available for each report fully described in our help documentation.
One of the main aspects that we had in mind when building the new reports was the loading time.
As you know, AWR does not have limitations regarding the number of keywords that you can track in a project, or the number of projects that you can have with one account.
However, working with filters on large data sets in Data Studio, without a Google BigQuery integration, sometimes results in slow performance.
With the new report types, we introduced project settings and keyword performance filters at the Data Source setup level.
This way, the amount of data processed on Google Looker Studio side becomes smaller, thus reducing the loading time for your report pages.
Now, let’s look at some report widget models where you can use the AWR rank data.
Keywords And Landing Pages Widget Models
Presenting the results of your work comprehensively is challenging, especially since it’s easy to get lost in detail with so many data visualization options available nowadays.
I think that the best way to start building your report is to review the goals with your audience. Widgets, dimensions, and metrics might differ based on who is receiving the report, so this negotiation is crucial for the report’s success.
Here are some suggestions on how you can present the data from AWR in Google Looker Studio reports.
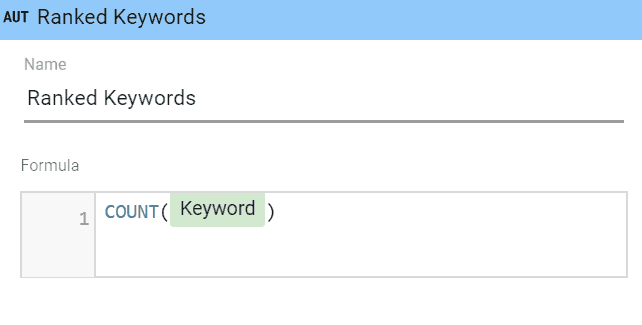
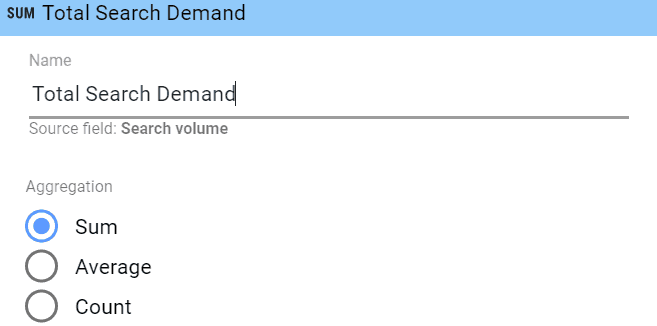
KPI Scorecards
With ranking data, KPIs need to reflect the keyword position changes, as well as the search demand changes.
Usually, you can arrange them in performance groups (e.g., Ranking changes, Traffic changes) and ordered by importance.
Here are two examples with calculated fields and ready-to-use metrics:
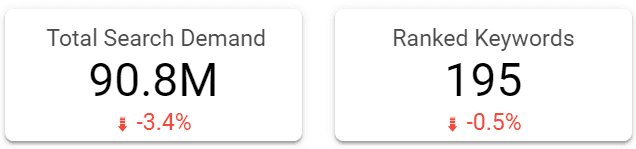
Ranked Keywords is a calculated field which counts the ranked keywords found on the latest update date available on the Data Studio report.
Total Search Demand is a Search volume metric, adding up the average monthly searches for all ranked keywords in the report.
Tables
Google Looker Studio offers powerful built-in features like heatmaps, bar charts, and more, taking simple report tables to a whole new level.
Here is an example with the Keyword Rankings in time report type, set as a data source:
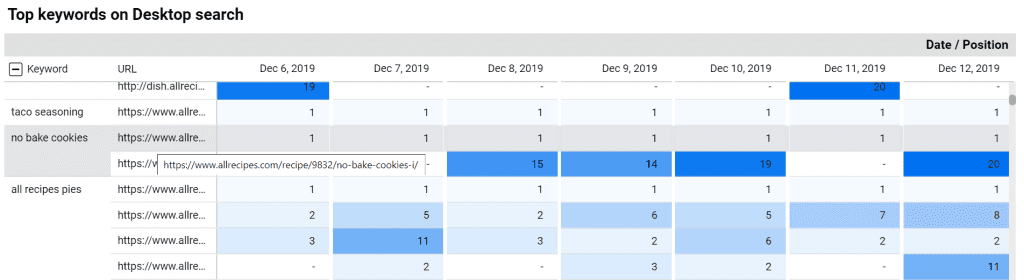
That is a pivot table widget with heatmap, using “Keyword” and “URL” as row dimensions and “Date” as column dimension (Expand-collapse options is enabled). “Position” is set as a metric.
Charts
Charts are the best way to tell the story, helping you to demonstrate proportions or changes in time.
Google Looker Studio offers a lot of exciting options for making the information visually attractive, from a simple line or bar charts, to advanced options like scatter plots and treemaps.
For this SERP Feature Distribution example, I am using horizontal bar charts showing the proportion of result types in Google Universal search.
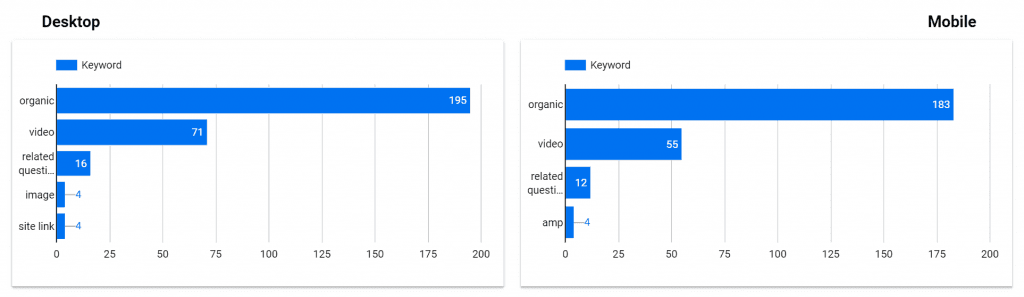
Sometimes, a website may rank with different types of results for the same keyword (e.g., your page can be listed as a Featured Snippet and also as an Organic entry in top 10 results). In this case, AWR will count each type of result individually.
The models available in this section are extracted from the “Rank Performance Audit Report” sample that you can find below. You will have the possibility to duplicate the report and use it with your AWR ranking and visibility data.
Rank Performance Audit Report
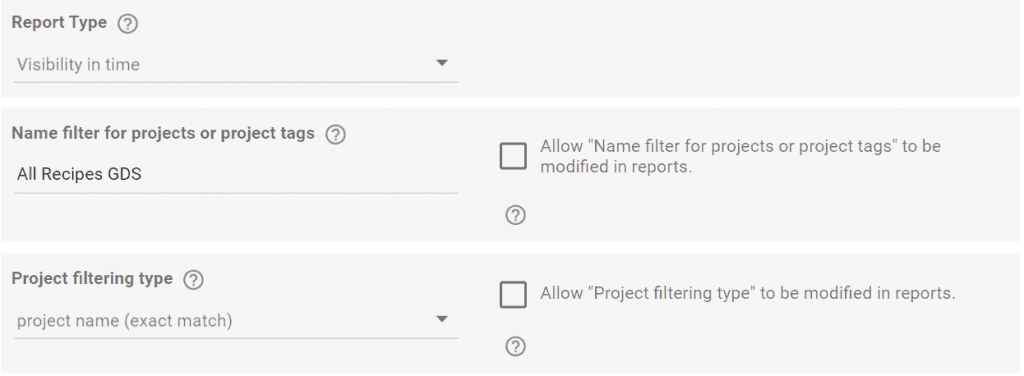
This report was built together with Cristina Constantinescu, our new VP of Marketing at Advanced Installer, as a starting point for her new SEO project.
We ran a keyword research session for the Advanced Installer domain and set up the project in AWR with almost 200 keywords.
The rankings were monitored daily across Google Desktop and Mobile with blended search results.
Then we set up 3 data sources with AWR Data and related filters:
Visibility Evolution In Time
Keyword Ranking Date Comparison
Keyword Ranking Evolution In Time
Visibility Evolution In Time Setup
Keyword Ranking Date Comparison Setup
Keyword Ranking Evolution In Time Setup
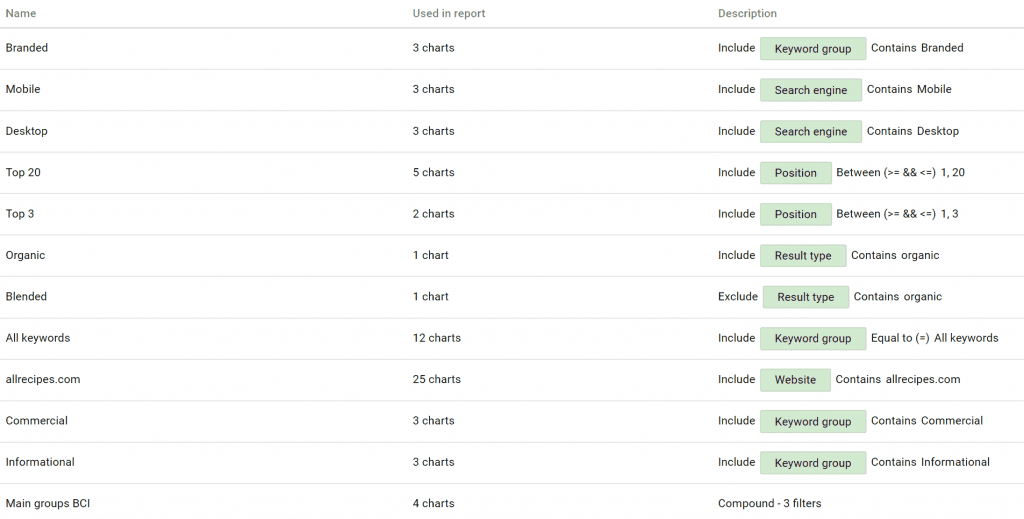
Filters
Here is a short description of what we measured on each report section:
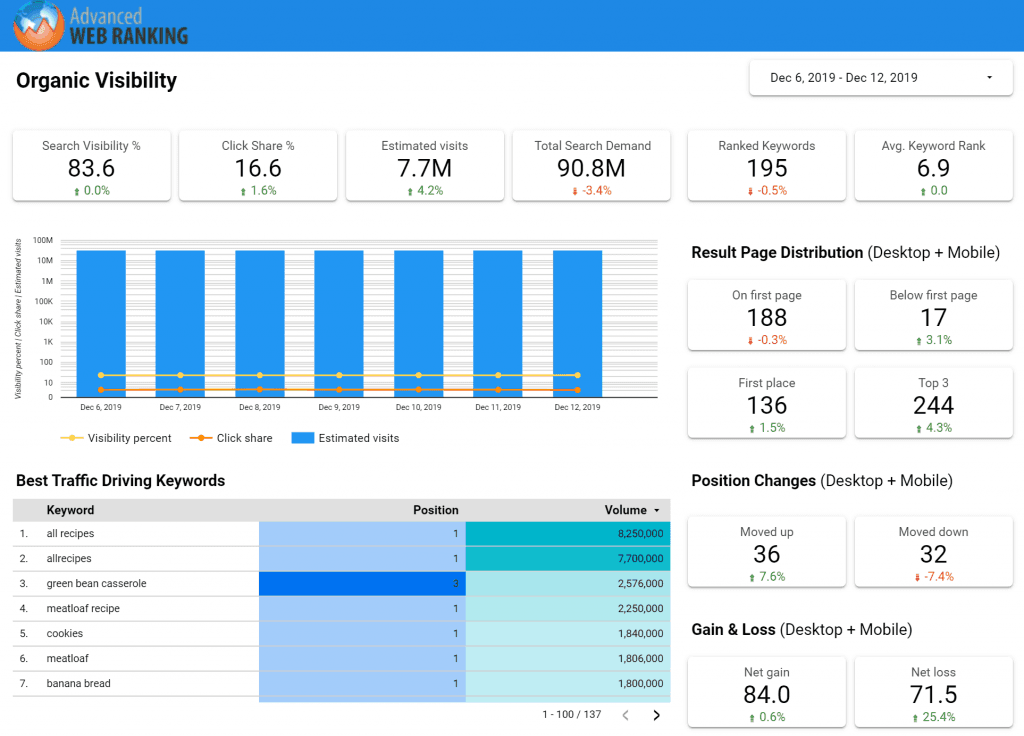
Organic Visibility
The first page shows the organic visibility summary with trends over the last seven days of ranking updates.
We used two data sources for this page:
Visibility Evolution In Time, which helps to build the chart and the visibility and traffic KPIs.
Keyword Rankings Date Comparison for the keyword position table and the search demand KPI.
For all widgets that we built with the “Visibility” data source, we used a filter for All keywords group.
This way, we made sure that the values for each keyword were counted only one time, even if the keywords in question were assigned to multiple groups.
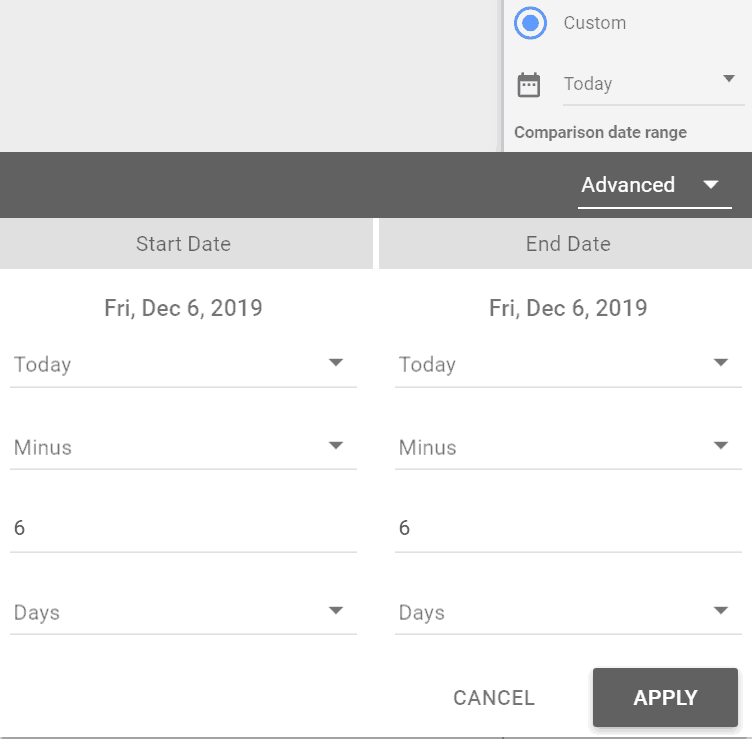
Regarding the date range, the report had a static time interval because we needed the stats for a limited time.
However, if you plan to use some of the widgets here on an ongoing basis, you can use the “Last x days” date range for the chart and a correlated comparison frame for the scorecards.
Keyword Group Performance
Upon setting up the keyword set for this project, we also defined three main keyword groups that we needed to evaluate: branded terms, commercial, and informational.
It helps determining the initial search visibility and traffic performance according to the search intent.
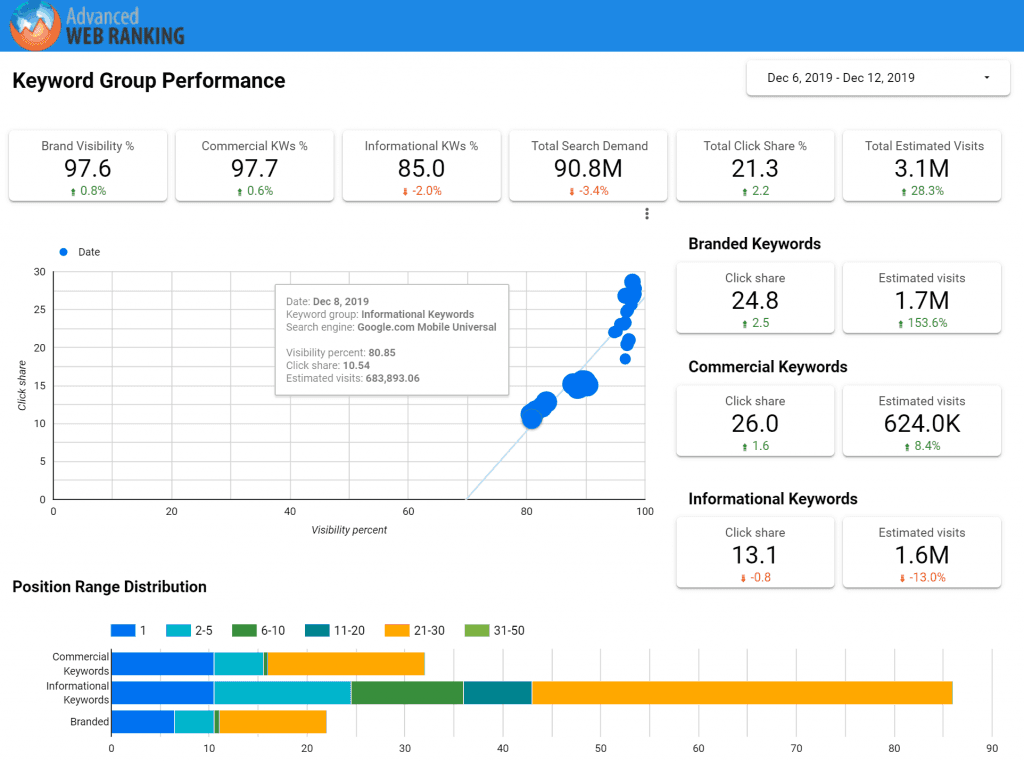
This page uses the same data sources as the first one. However, the filters applied are specific for each keyword group.
We set up the keyword group performance chart as a scatter chart in Data Studio, using the “Visibility In Time” data source.
The “Date,” “Keyword group,” and “Search engine” are set up as dimensions, and “Visibility %,” “Click share,” and “Estimated Visits” as metrics.
In this example, the more bubbles we have to the top right corner, the better. It means our keyword groups have a high click share and visibility %.
The rank distribution section, on the other hand, is built as a bar chart, and all metrics are renamed, or set as calculated fields.
For example, the visibility metric called “First position” is renamed to 1, Top 30 metric is renamed to reflect the 21-30 position range, while the 2-5 range is calculated as Top 5 - First place.
Desktop & Mobile SERPs
Next, we wanted to see what types of content gets listed in the SERPs from the Advanced Installer domain, because the team does not target only organic positions, but also video and images.
For this page, we used only the “Keyword Ranking” (date comparison) data source, and we were able to see a precise distribution of different types of content for both desktop and mobile searches.
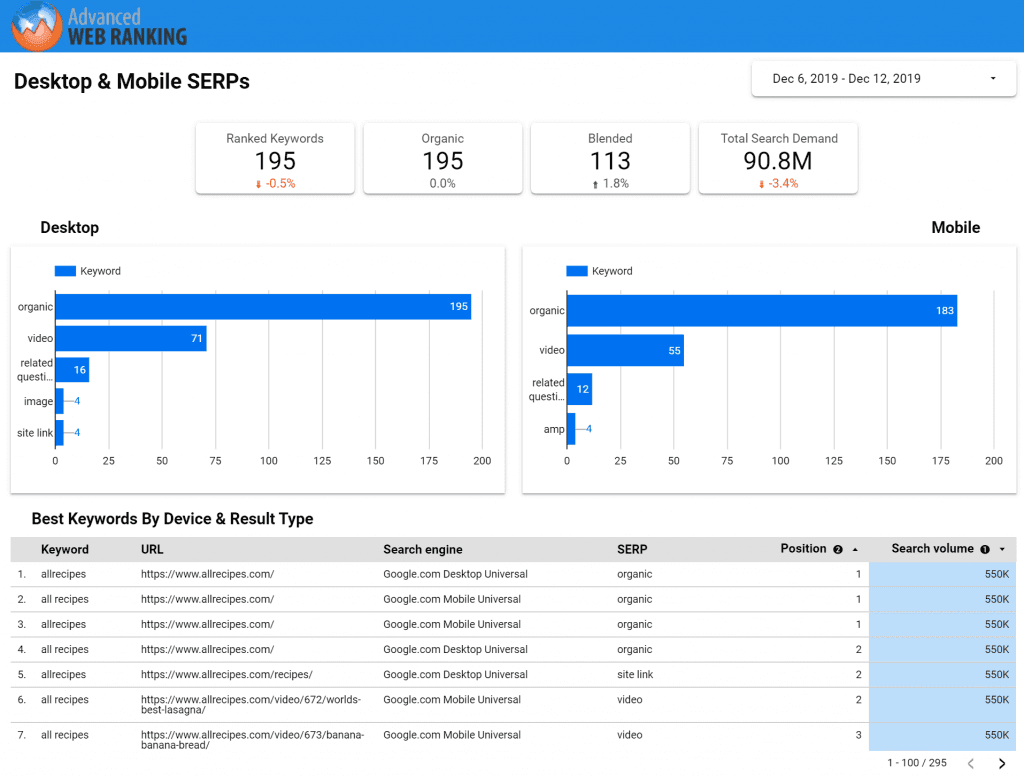
To build the bar charts, we took advantage of the possibility to convert dimensions to metrics which is offered by Google Looker Studio. We set the result type as dimension and Keyword as metric in this case.
That way, on each bar, we can see the number of keywords which is associated with a particular type of result.
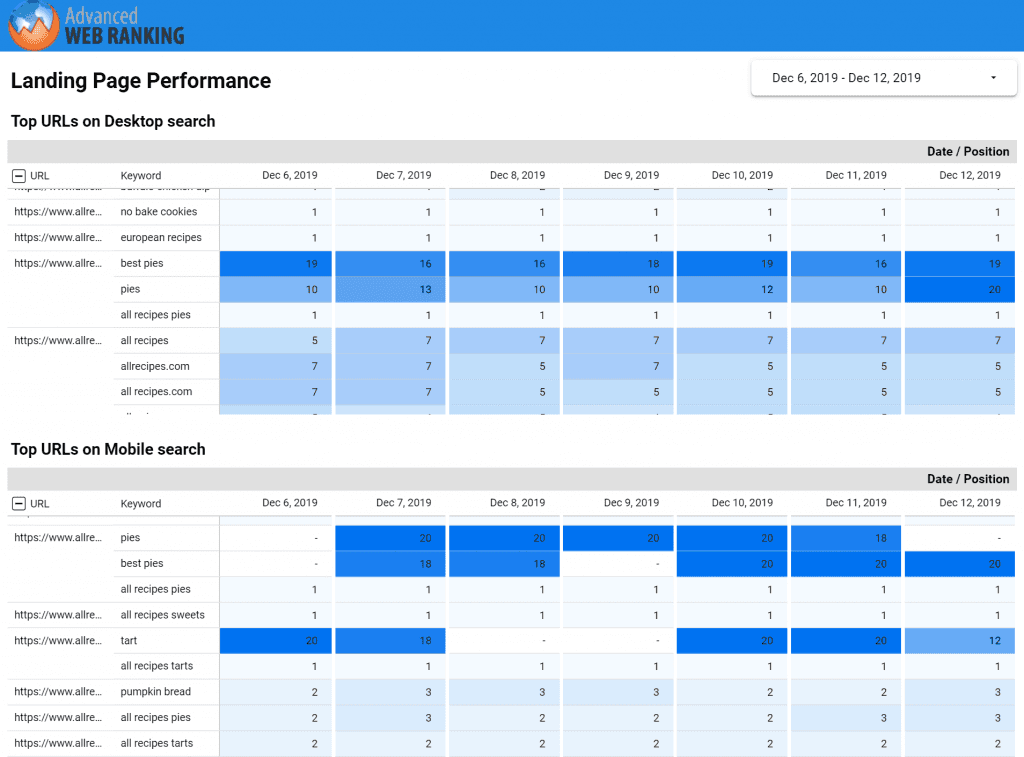
Keyword and Landing Page Performance
In the last two sections of our report, we took a closer look at granular data, comparing side by side positions across multiple dates.
The purpose was to identify the best ranking keywords and URLs, but also to check their volatility.
Back to you
That’s about it!
With the new AWR connector for Google Looker Studio, you can quickly get the keyword positions and visibility stats automatically in your reports.
Hopefully, the widget and report samples above will give you ideas on how to present AWR data to your customers or your team.
I would be more than interested to hear what types of widgets you prefer for presenting ranking data in Google Looker Studio.
Feel free to share your thoughts below. :)

Article by
Aura Dozescu
Aura Dozescu was a Customer Care Specialist for AWR. Passionate about Internet Marketing and SEO technologies, she worked closely with SEO software developers to implement the feedback received from customers.


stay in the loop