
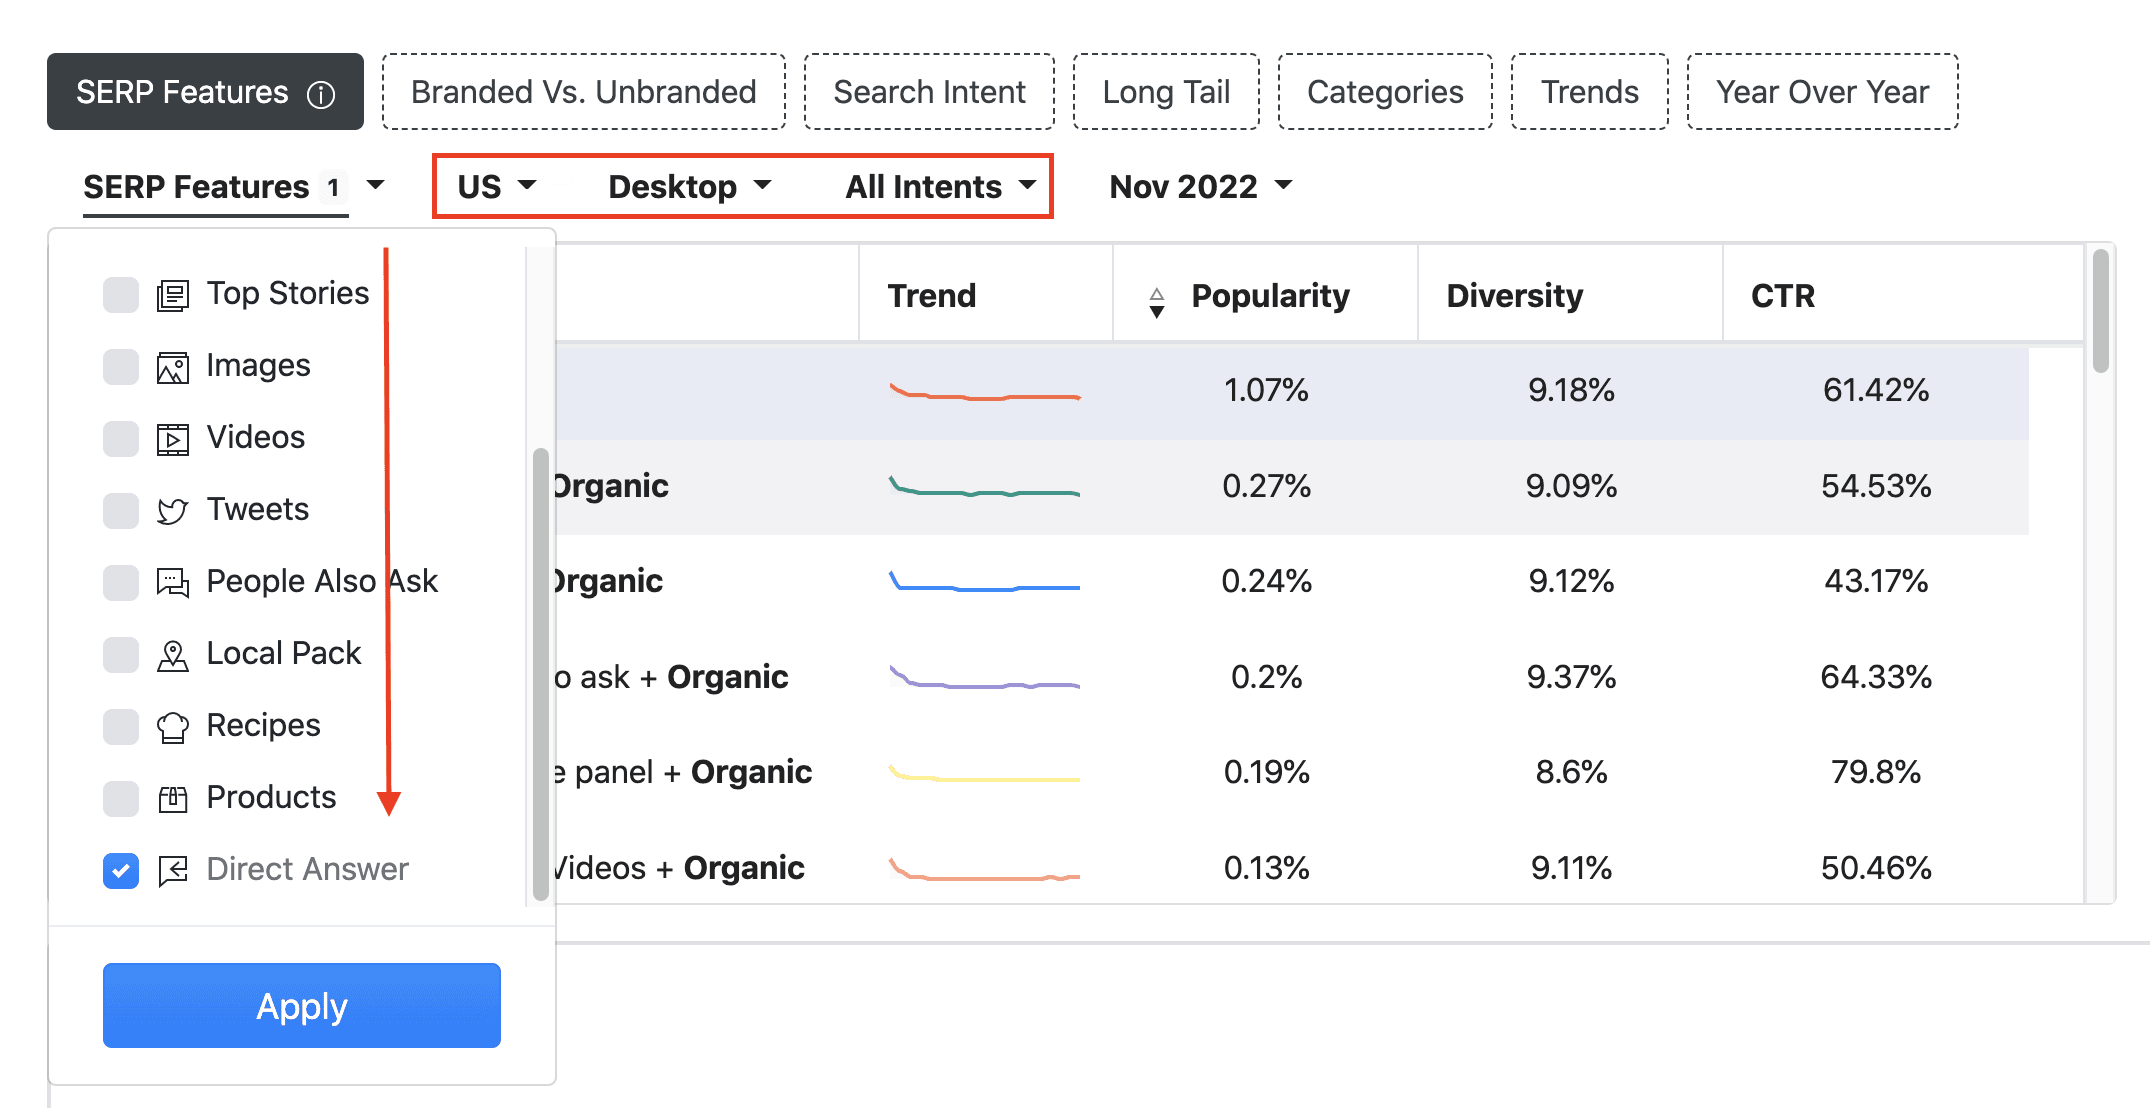
Before we analyze the changes in clickthrough rate during the fourth quarter, I am happy to announce you that our free CTR SEO tool has been updated to include a new filtering option for the ‘Direct Answer’ result type, as well as search intent categories in the SERP Features view.
The search intent categories include Navigational, Informational, Commercial, and Transactional, and this feature is now available for the US market on both desktop and mobile queries.
Navigational searches are made by users who are searching for a specific brand or service. They are aware of the specific webpage or website they want to access (such as Facebook login or Youtube), but they require assistance in finding the correct URL.
Users often engage in informational searches during the discovery phase when they wish to gain knowledge on a specific subject, such as news, restaurants, flights, education, etc. These types of searches are the most frequent and have the highest search volume as people are always seeking information.
Commercial searches are conducted during the consideration phase by users who are seeking to gather information before making a purchase decision. In this stage, users are looking for information such as reviews, alternatives, and top/best products to aid them in making an informed choice.
Last but not least, transactional searches are performed by users who have already completed the research and consideration phases and are ready to take action. These types of queries are not limited to purchases only, they may also include actions such as signing up for a newsletter, starting a trial, downloading software, etc.
Clickthrough rate in 2022 vs. 2021
With the data for the entire year 2022 now available, we can compare the average CTR values for each position in 2022 to those in 2021.
We can see that the CTR values for websites ranked first on both desktop and mobile devices were significantly impacted. Specifically, the websites ranked first on desktop saw a decrease of 1.49 percentage points (pp) in CTR in 2022 compared to 2021, while on mobile the decrease was even greater at 1.61 pp.

Now let's examine how user behavior affected click-through rate values during the fourth quarter of 2022 in comparison to the third quarter of the same year.
All searches
At a global level, the changes affected only the desktop queries, where the websites ranked first registered a 1.11 pp decrease in CTR.
Branded vs. Unbranded queries
Significant changes were recorded for the branded queries on mobile searches only. More precisely, for those searches containing specific brand or business names, the websites ranked in the first position on mobile experienced a 1.38 pp decline in CTR, while those in the second position witnessed a 1.05 pp drop.
Search intent
Websites ranked in the first two positions for commercial queries (those containing words such as price, pay, buy, etc.) recorded a combined 3.28 pp loss in CTR on mobile (2.21 pp for those ranked first and 1.07 pp for those ranked second). On desktop, the loss affected the websites ranked first only, which witnessed a 1.06 pp decline in clickthrough rate.
Drops in clickthrough rate values were recorded for informational queries (containing words such as what, when, where, how, etc.) as well, with websites ranked first, losing 1.01 pp on desktop queries.
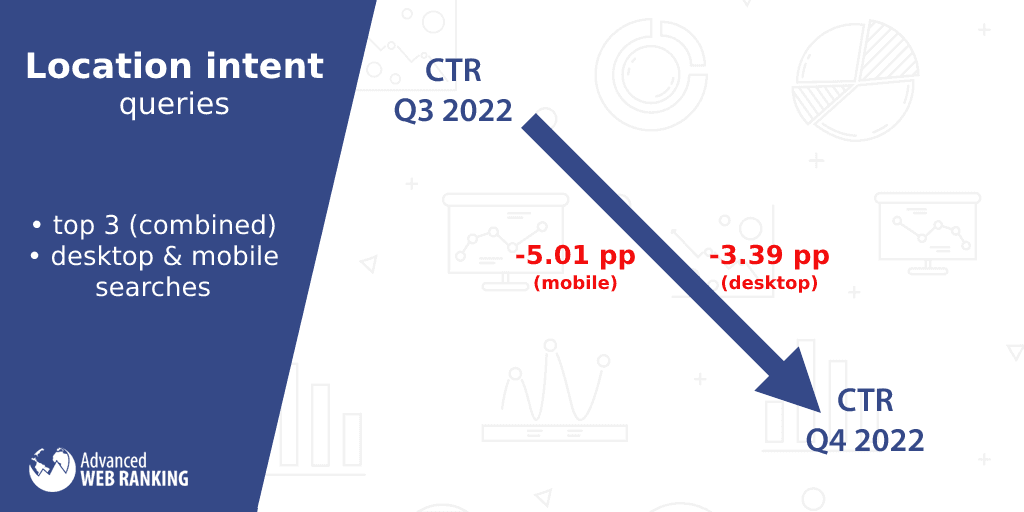
As for location queries (containing words such as near, from, nearby, directions, maps, etc.), the websites ranked in the first three positions recorded drops in CTR on both desktop (3.39 pp combined) and mobile queries (5.01 pp combined).
Keyword length
The websites ranked first on desktop recorded different percentages of decline in CTR as follows:
for 2-word queries, the decrease in CTR was 1.37 pp
for queries containing 3 words, the drop was 1.14 pp
As for the mobile results, only the CTR values for the websites ranked first on queries containing one word were affected, registering a 1.04 pp drop.
Industries
This is where we'll be adding search demand data to the study and correlating click-through rate values with the search demand trend for industries that experienced CTR changes.
To make it easier to follow, I’ll just divide the CTR changes analysis into two sections, based on search demand evolution (either positive or negative):
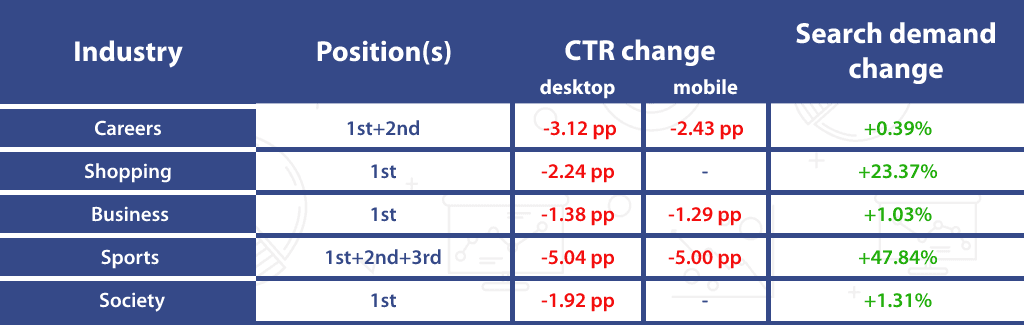
A. Industries where the search demand increased
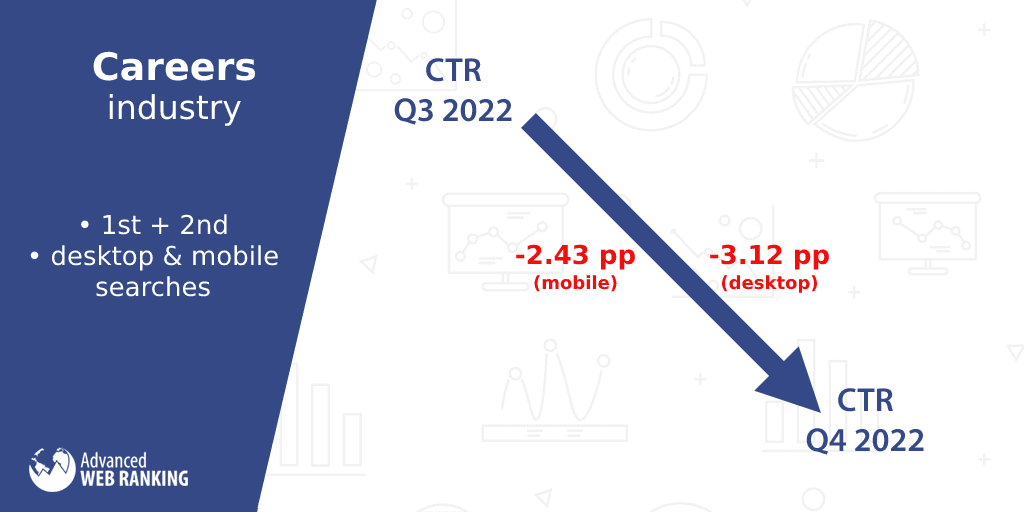
The websites ranked in the first two positions in the Careers market recorded a combined 3.12 pp loss in CTR on desktop (2.01 pp for those ranked first, and 1.12 pp for those ranked second). The declining trend was reflected on mobile, as well, where the website ranked in the first two positions witnessed a combined 2.43 pp loss in CTR (1 pp for those ranked first, and 1.43 pp for those ranked in the second position). On the other hand, the search demand grew slightly for this industry, by +0.39%.
It was anticipated that the Shopping industry would see an increase in search demand during the fourth quarter due to events like Black Friday and the holiday season, and this was confirmed by a +23.37% increase in impressions recorded by our search-demand tool. As for the CTR values, the websites ranked first on desktop registered about a 2.24 pp decrease.
Being the industry to record the highest increase in clickthrough rate in the previous quarter, Business experienced a drop this time. Here, the websites ranked first witnessed a 1.38 pp loss on desktop and a 1.29 pp drop on mobile devices, while the industry’s overall impressions increased by +1.03%.
Now let’s have a look at the industry with the highest increase in search demand: Sports. With an impressive growth of +47.84% in impressions, the CTR values went in the opposite direction, with the websites ranked in the first three positions witnessing a combined 5.04 pp loss on desktop and a 5.00 pp decline on mobile devices.
One last market where the search demand grew (with +1.31%) is Society. Nevertheless, the CTR values went in the opposite direction, at least on desktop, where the websites ranked first registered a drop of 1.92 pp.
Here’s a graphical representation of the changes in all five industries mentioned above:
B. Industries that experienced a drop in search demand
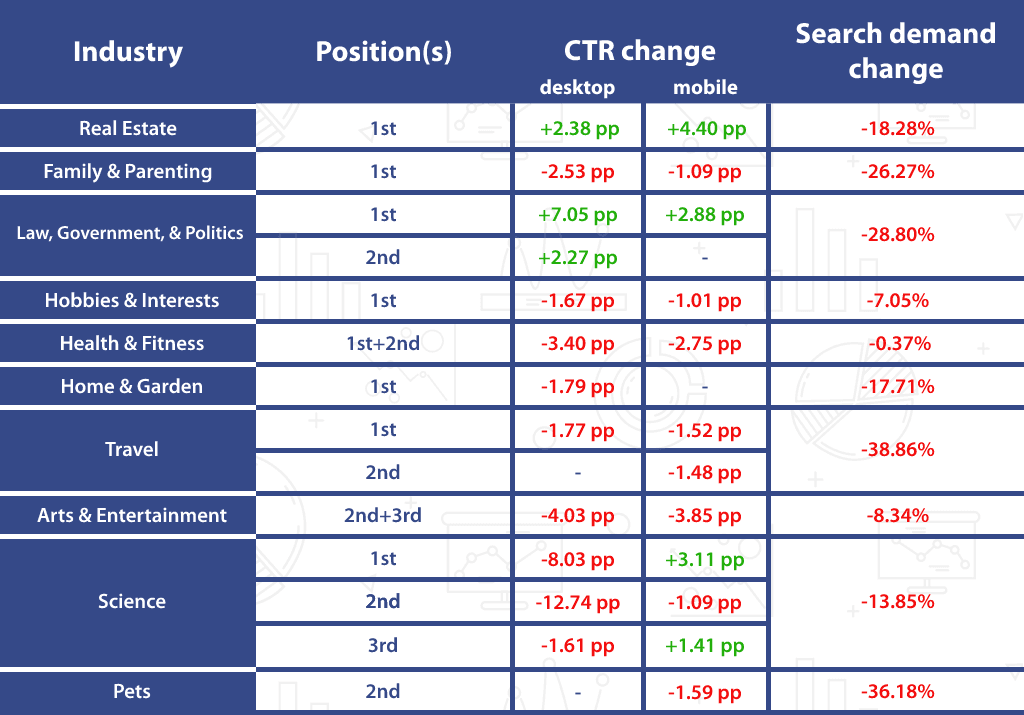
Despite the drop in search demand (-18.28%), the websites ranked first in the Real Estate industry recorded a 2.38 pp increase in CTR on desktop, while on mobile, these websites witnessed an even greater boost, of 4.40 pp.
Family & Parenting recorded a decline of -26.27% in search demand. At the same time, the websites ranked first registered a 2.53 pp decrease in CTR in desktop searches, and a 1.09 pp drop in mobile results. Coupled with the industry’s search demand drop, these websites might expect a significant loss in organic traffic.
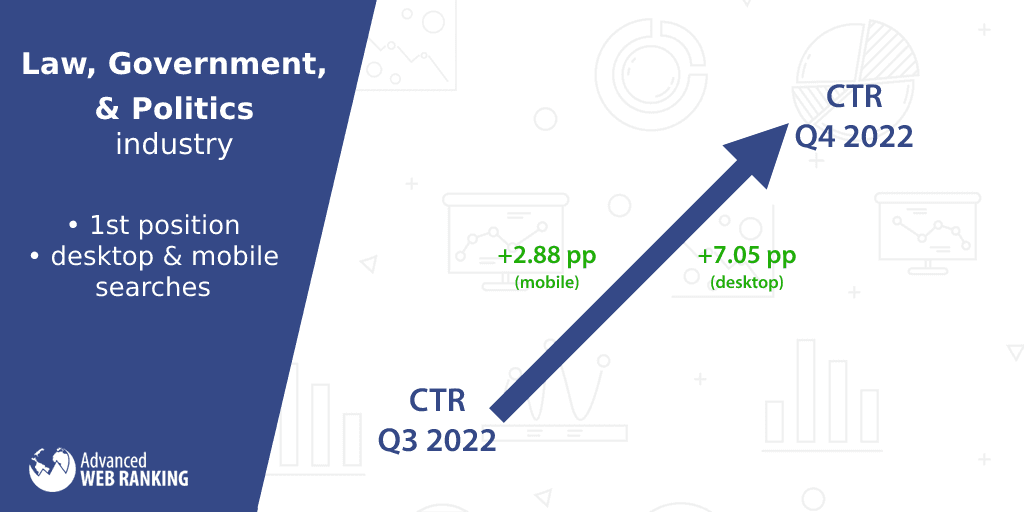
And now let’s jump to the industry with the highest increase in clickthrough rate for a single position: the Law, Government, & Politics one. Here, the CTR for websites ranked first on queries made from desktop devices grew, on average, by a remarkable 7.05 pp, while on mobile, the changes reached a 2.88 pp growth. Websites ranked in the second position on desktop searches were also affected, seeing a 2.27 pp boost. However, the industry’s overall impressions dropped by -28.80% in Q4 compared to Q3.
In the Hobbies & Interests industry, websites ranked first recorded a 1.67 pp drop in CTR on desktop, while on mobile the decline equaled 1.01 pp. At the same time, the total number of impressions decreased, by -7.05%.
With no major changes since Q2 2022, the websites ranked in the first two positions in the Health & Fitness industry recorded a combined 3.40 pp loss in CTR on desktop and a 2.75 pp drop on mobile devices. At the same time, the overall industry’s impressions decreased almost insignificantly, by -0.37%.
A similar trend occurred in the Home & Garden industry, where just like in the Health & Fitness market, but after two dormant quarters this time, the clickthrough rate values experienced changes once again. Here, the websites ranked first on desktop recorded a drop of 1.79 pp in CTR, while the industry’s global number of impressions decreased by -17.71%.
People’s interest in travel declined after the end of the summer holidays in Q3, as shown by a decrease of -38.86% in impressions on our search demand tool. At the same time, the CTR for the websites ranked first in the Travel industry decreased by 1.77 pp on desktop, while on mobile, the drop affected both the websites ranked first (a 1.52 pp drop), and those ranked in the second position (a 1.48 pp decline).
As for the Arts & Entertainment industry, surprisingly, the websites ranked first weren’t quite influenced by the changes. However, those ranked in the second position registered a 3.01 pp drop in CTR on desktop and a 2.41 pp decline on mobile, while for those ranked in the third position lost, on average 1.02 pp on desktop and 1.44 pp on mobile. Here, the search demand decreased by -8.34%.
It’s time to turn our attention to the fourth quarter’s most significant steep decline in clickthrough rate: the Science market. Here, the websites ranked in the first three positions recorded a combined 22.38 pp loss in CTR on desktop (8.03 pp for those ranked first, 12.74 pp for those ranked second, and 1.61 pp for those ranked in the third position).
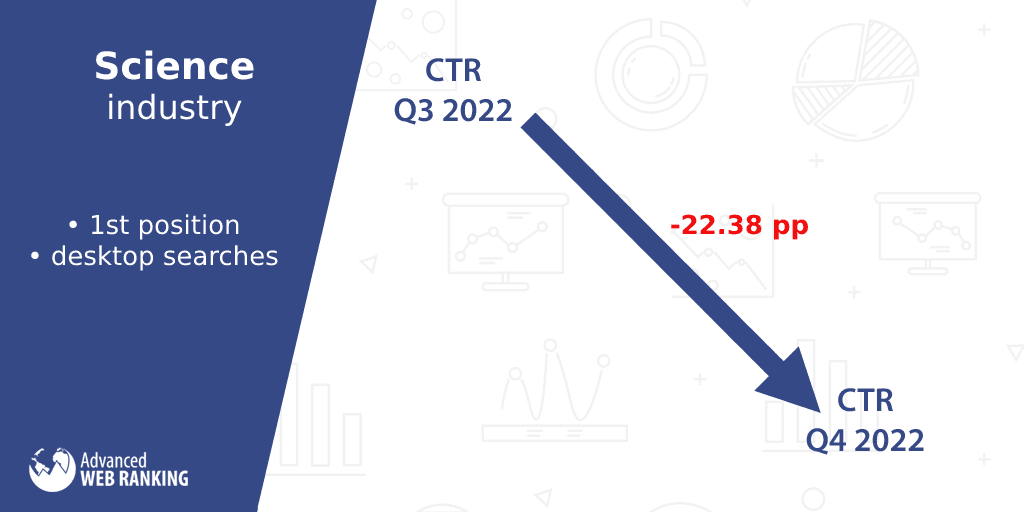
On mobile, the loss affected the websites ranked second only, which witnessed a 1.09 pp decline, while those ranked first and in the third position recorded growth in CTR (3.11 pp and 1.41 pp respectively). At the same time, the overall industry’s impressions decreased by -13.85%.
One last market where the search demand dropped (with -36.18%) is Pets. Here, the CTR values for the websites ranked in the second position on mobile devices registered a decrease of 1.59 pp.
Here’s a visual round-up of the CTR evolution for the industries mentioned above:
That’s it for…the fourth quarter
It has been quite an eventful quarter! We analyzed the year-over-year comparison and identified the areas and industries affected by the changes.
And our next report on changes in click-through rate might be even more intriguing as it will likely provide insights into Google's implementation of ‘Continuous Scrolling’ on desktop, which started at the end of this quarter at the beginning of December.
But we'll have to wait until the next quarterly analysis CTR report to learn more. Until then, stay safe and healthy!

Article by
Dan Popa
Dan Popa is an Online Marketing Strategist at Caphyon. He is passionate about both Online and Offline Marketing and he's always looking for new ways of applying the basic principles of marketing in the fast-evolving SEO field. He's always in the mood to chat about new creative ideas for campaigns, so you can find him on Twitter.


stay in the loop