For most SEO agencies, freelancers and in-house workers, creating those monthly SEO reports is usually one of their least favorite tasks.
These essential reports often seem to take forever to pull together and often leave you pulling your hair out in frustration in the process.
To make matters worse, you must provide your client with essential performance data that showcases how your hard work has improved their rankings.

But most of the people you’re reporting to don’t care about the details.
They just want a useful report that is concise, straightforward, and easy to read and understand.
So, what should you include in your SEO reports?
What should you leave out?
What does your client or upper management need to know?
To help you through this process, I’ve created a useful SEO report template that will simplify the entire reporting process.
Here is a sneak-peek of what it looks like:

I will show you how to copy and customize this template for your own needs at the end of this guide.
But first, let’s run through what these SEO reports are and which key elements they should contain.
What is an SEO report?
An SEO report is a monthly report that shows your clients how their website is performing and how your input is producing positive results.
Depending on the performance goals and requirements of the client, you could include information such as:
Organic traffic
Keyword rankings
Channel performance
Engagement (e.g., bounce rates and time on site)
Conversions
E-commerce transactions
Link acquisition
Site health
Page Speed
Site impressions
This report is a vital part of your daily work as an SEO as it demonstrates to your clients or upper management that your work is providing high ROI and highlights the progress you’re making.
It also gives you the chance to analyze how effective your current SEO strategies are and provides a valuable opportunity to develop a game plan for the months ahead and make tweaks where needed.
You’ll also be able to track key market trends to help you stay ahead of your competitors - not bad results for a simple report!
Although you might feel tempted to impress with tons of information, it’s better to keep the report as simple as possible.
Keep it easy to read and understand.
One great way to do this is by providing a summary of key SEO metrics and then giving more detail further on within the report, more on that later.

Plus, using the right SEO reporting tool can also make a difference and offer a much better experience for your clients.
What should you include in an SEO report?
Every single monthly search report should be tailored to the precise needs and requirements of your client.
It’s no good providing a full backlink report if what your client wants to focus on the most is how much revenue you’ve driven for them.
When you create SEO reports for clients, you need to tightly tie them to business metrics that matter while also showcasing the value that you are delivering as an SEO.
That’s why I recommend you use the template but cater it specifically to your audience.
That said, there is vital information that every SEO report should contain.
The report should include a summary page, detailed reports into the key metrics that your SEO strategy focuses on plus a complete final summary and recommendations.
The precise individual pages that you choose to include as part of your final report are ultimately up to you.
What follows is a run-through of the key pages you should include in your SEO report.
Summary page
Every SEO report should contain a clear summary page that provides all the information that your client or boss wants to know at a glance.
It should explain the project focus and results, compared with past performance and competitors, if required.
The summary page is excellent for people who are short on time or those who don’t understand the ins and outs of SEO.
They can understand your achievements without having to dive too deep, understand the technical terminology, make sense of the data, or even read the rest of the report.
This page should be as short and straightforward as possible and spell out that your work has achieved results.
For example, a 15% increase in traffic over the past month and 50 new leads generated as a result of your latest SEO campaign.

AJ Ghergich
CTO & President, Digital Intelligence, Brado
If your report is not a short and sweet executive summary, nobody will read it. You can link out to deeper research, but your client should understand what is happening at a glance.
Summarize:
Monthly SEO Activities – Highlight your research and optimization.
Conversions – Show them the money.
Landing Page Traffic – Which landing pages are driving traffic? Be sure to highlight any landing pages with below average conversion issues.
Link Growth – What is their link earning velocity compared to competitors?
Keep it simple and show your value in a way that is easy for your client/boss to process.
The precise metrics you include in the report depend on the goals and requirements of your clients. However, you should aim to include:
Project goals and KPIs
Summaries of increases or decreases in organic traffic
Tasks completed
Open action items that require attention
Other major deliverables completed
A results overview
The next steps you plan to take toward achieving these new goals
An overview of the general SEO health of the site.
When you talk about these elements, try and tell a story with the data you are displaying.
Add background about why you see the changes, what the data means, and what you are going to do about it.

Matteo Monari
Co-Founder, BizUp
I think the most important element in SEO – as in any reporting – is storytelling: adding a basic logic narrative to it keeping in mind what is more important to the client.
In the SEO case, a typical narrative would be like:
This month we implemented X on-site and focused off-site activities on area Y. As a result, rankings for KWs belonging to cluster X and Y increased, and so did organic traffic (+K%), which resulted in more leads/sales for you (+Z%)… and this logic flow works of course even better when supported by AWR reports such as keyword ranking, visibility report and AWR’s integrated Search Console data.
You can find an example of this in the template I’ve created that provides a space for you to write a quick executive summary to talk about how great you’re doing:
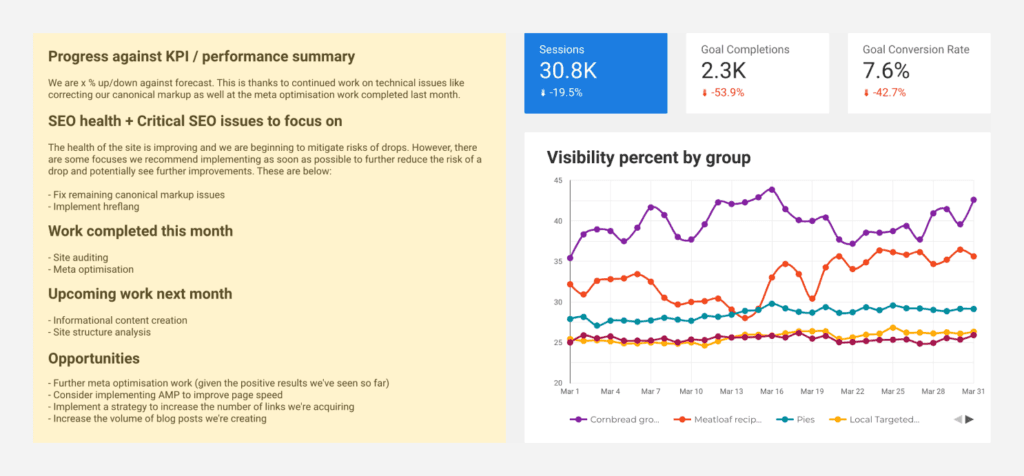
Summary page KPIs
When you’re defining what to include in your summary with your client, try your best to guide them on the types of SEO KPIs that you should use.
Make sure that they tie back to important business metrics as well as work well for SEO.

Ria Fiscina
Search Engine Optimization Analyst
Often, the client is trying to solve some sort of transparency issue on their end, or data they think is integral to a campaign, but are unable to express why.
We’ll work with the client to understand what it is they’re trying to achieve and then offer solutions that are acceptable client-side & agency-side. The biggest help in this is educating clients on KPIs, then reporting on those and factors that relate directly to them.
Again, remember to keep it easy to understand.
Use everyday language as free from jargon as you can so that everyone can understand.
Charts, figures, and technical terms are a great way to explain the information but ensure you’re not overwhelming the person to which you’re reporting.
Plain English often goes a long way.
Also, make sure if you’re going to edit any page of the template, make it this one.
You want this page to include just the key things the person you are reporting to is interested in, which is more than likely also going to cover the ROI if you’re working as a consultant or agency.

Daniel Tannenbaum
Head of SEO, Tudor Lodge Consultant
Most companies (especially senior staff) focus on ROI and trying to relate that to your SEO reports and rankings can be very effective.
Rather than saying that we jumped up 20 positions for every keyword, it is powerful if you can say that previously you were spending £3 per click, but since doing SEO, you are now spending £1 per click and getting better traffic. That is how you blow peoples’ minds.
General SEO health
One of the critical elements of this summary report is discussing the health of the site.
Make sure to stress the need for fixing critical SEO issues and also try to give an overview of how well optimized you think the site is.
You can see an example of a short write-up I’ve added into the template for the kind of things you need to talk about here.
If you find that your critical SEO issues aren’t being addressed, then consider creating a risk assessment for the site to illustrate that by not fixing things, the site could begin to see less traffic.
A key thing I like to make decision-makers aware of is that SEO is not just an offensive traffic improvement strategy. It’s also a defensive strategy to protect the traffic you already have.
Future opportunities & execution plan
Within the summary page, it’s also a great idea to highlight a clear list of new opportunities to enhance your search strategy.
It’s best to include this in the summary so that any execs that want to scan the report can see that there are ways in which they use their budget to enhance the organic channel further.
I always recommend to include this section as it will prevent the SEO report from being a dull piece of data and make it useful, actionable, and help the business move forward as a whole.
PRO TIP
If you’re working in an agency, this is an ideal location to start planting the seeds for a potential upsell to the client.
If you’ve just had a great month, talk about that in the “Summary page” and then suggest increasing link acquisition targets or blog creation time for a larger retainer.
This section doesn’t have to be long. It could simply bullet point some things you think that you recommend doing to improve organic performance further like this:

Organic traffic summary report
An organic traffic summary report allows you to focus specifically on organic and highlight trends over time to illustrate the progress further your SEO efforts have made.
It’s an essential part of an SEO report, so I’ve included it on the summary page.
It should include a complete history of organic traffic trends, comparing both sessions and pageviews with the previous year and previous month, if applicable.
Here is an example of the year-on-year session trend in the dashboard:

You should also include the bounce rate and other key engagement metrics to provide a well-rounded picture of the quality of the traffic.
For metrics like these, a simple scorecard that compares YoY results works well like the below:

Again, your client may not understand the metrics, so be sure to provide a written summary of these developments and explain what this means for their business.
Traffic channel overview
Provide a breakdown of traffic channels so your client can see which are bringing the most visitors to your site and gain a better overview of website performance.
Be sure to include organic search, direct traffic, referrals, and paid search, comparing the figures against past performance and each other.
One great way to do this is by providing a top-level session trend chart, but then using a 100% stacked bar chart to showcase the percentage differences each channel contributed each month:

Make sure to highlight any changes and explain how your efforts have caused this change in channel contribution. Remember to state in clear language why a particular strategy is working well.
If you notice a drop in traffic, make sure you address these changes with your client/upper management and suggest reasons why these changes might have happened and the impact this might have on website performance as a whole.
One thing you may spot with this analysis is that paid traffic is beginning to contribute more while organic traffic is contributing less. If so, investigate why that is the case.
You may find that overspend is happening in paid traffic, which is cannibalizing what you would have received for free via organic.
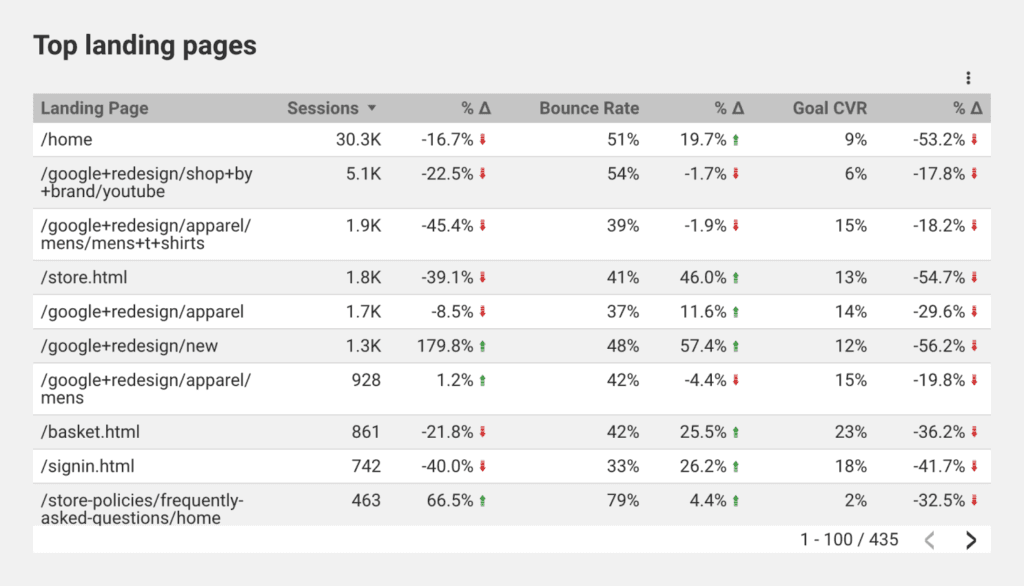
Organic landing page report
The organic landing page report allows you to dive deeper into which pages on your site generate the most traffic.
You’ll also get insight into key metrics such as engagement, bounce rates, conversions, and other useful user behavior data.
This report helps you to understand what is getting readers engaged and driving conversion - crucial information for business websites!
Here’s a screenshot of the kind of thing you’ll be looking at:
PRO TIP
It’s well known you can find landing page metrics via Google Analytics. All you have to do is head to the [Behavior] tab and select [Site Content] then [Landing Pages], and voila, the information is yours.
But did you also know you can get landing page visibility data from Advanced Web Ranking? There is a handy report that can give you further insights into keyword performance by URL.

Organic traffic by device & demographic
Providing an organic traffic breakdown by device offers more than just metrics about browsing habits.
It provides vital information that can help you better understand your organic traffic and influence your overall marketing efforts to fit the needs of the market.
As a result, you’ll be able to better focus on which version of your site needs to be worked on as far as the UX (user experience) and UI (user interface). You can see this included in the template twice, once in as a 12-month breakdown:

And then again as a pie chart just showing last months % split:

While a lower priority for a monthly report, you could also occasionally add some Google Analytics demographic data. It can help you develop detailed user personas that can guide future efforts and identify key trends as they develop.
Keyword performance report
A keyword performance analysis is an essential part of any SEO report.
This kind of report allows you to track your progress your SEO campaign is making against target keywords, which in turn helps you to understand whether what you are doing is working effectively.
This report will demonstrate how your client’s search visibility and rankings have improved since you started to work together while also helping you with identifying opportunities to further optimize for keywords.
You should consider including:
Which keywords visitors are using to find the site
How traffic from non-branded queries are trending
Which keywords you’re ranking for
The position of your rankings
A comparison of the websites keyword ranking to their competitor
PRO TIP
Here’s where the Advanced Web Ranking data studio connector shines.
You’ll be able to pull out fancy reports showing how well your site is performing against target keywords as well as the rest of the market automatically!

In the above example, you can see the Visibility Percentage metric compared across your key competitors.
Outside of visibility, you can also use the [Keyword Ranking Date Comparison] or [Keyword Ranking Evolution In Time] data associated with the Advanced Web Ranking Connector for Google Data Studio to compare historical data automatically within your SEO reports quickly.
Some examples of the kind of reporting you should include in your report include things such as:
Ranking distribution trends
A ranking distribution trend chart shows at a glance the number of keywords grouped within different ranges such as top 3, top 5, top 10, and so on. Here is an example:

These are incredibly useful as it allows you to quickly spot if you’ve had an increase in rank into the top 3 (for example) and where those keywords have moved from.
To build on this idea, if you’ve got keywords grouped using tags (keyword groups), you can also see a 100% stacked ranking distribution by those tags like so:

This chart gives you a top-level view of where you’re performing well and where you’re performing not so well.
Visibility comparison
I’ve already shown a competitor visibility comparison, but you can use this metric combined with how your keywords are tagged to visualize your SEO visibility over time by each tag. Here is an example:

This representation allows you to spot where potential improvements or drops are coming from quickly and easily.
Keyword information can often seem quite abstract to the non-SEO professional, so make sure you’re explaining what this means with regards to website performance.
Give context by sharing historical data for the past years and months to understand progress.
You also need to make sure that your clients understand that any short-term changes aren’t necessarily anything to panic about. Normal fluctuation happens.
However, at the same time, be prepared to be first on the scene in the worst-case scenario of an algorithm update causing a drop.
You don’t want a client or your boss to spot a drop before you do.
Alongside that, you also need to make sure you aren’t afraid to include information relating to the keywords that aren’t performing quite as well as you’d hoped.
That provides a more balanced view, and your clients will appreciate your honesty, especially if you can back up this information with a clear explanation of how you will tackle this challenge.
Google Search Console
Google Search Console (GSC) is a handy tool that gives you real data on which queries are driving the most traffic to your site. This is a great accompanying tool to Google Analytics as you get another level to your reporting.
With GSC, you can now see exactly what queries are causing the increase/decrease in traffic you are seeing, which massively helps you with trying to decide your next steps.
Because of the obvious benefits to this tool, I’ve included a handy report to show how GSC metrics have trended over the last month, as well as a 12-month trend.

It’s also beneficial to show the query level data in a table with comparisons to see potential changes.
Notice a large drop for a keyword? This gives you an ideal opportunity to highlight the change within your summary page and mention what you plan to do to regain lost traffic.
Page speed insights
“Performance is a foundational aspect of good user experiences,” said Google last September.
And because Google continues to place an ever-greater emphasis on user experience, it’s more important than ever to ensure that your client’s page speed is up to scratch.
That’s why it’s essential to create a page speed insight section on your client’s SEO report.
You can use the Google Page Speed Insights to create a breakdown of their page load speed, explaining what a good, average, and poor page load speed look like.
One excellent feature of this tool is the recommendations provided with each speed test. You can use these to identify problems and highlight recommendations to your clients.
To give you an idea of what this will look like, I’ve run the Advanced Web Ranking website through the analysis, and here’s what it says.

Want to report on page speed in an automated way? One of the best ways to do this is by using the Chrome User Experience Report (CrUX). The CruX report contains real speed data reported by Chrome from users browsing your website.
All of this data is stored into one large BigQuery database so you can easily report on it. There is even a handy data studio connector so you can hook this data straight up to your reports.
I recently created a demo of how you can set up CRuX reports in Data Studio. To make it easily accessible, I also included it in this template. Here’s what it looks like:

If you’re unsure what these metrics mean, read into user-centric performance metrics.
They’re the best way to measure the experience a user is having on your site when it comes to site speed.
PRO TIP
This is another great opportunity to educate clients or upper management on why they need to take site speed seriously.
Showing decision-makers that a large percentage of users are having what Google classifies as a slow experience should hopefully make them pay attention.
Even better, show them that the web technologies competing sites use are better than what you use.
A great way to do this is by utilizing something like Wattspeed to see:
What tech competitors use on their site.
If the markup of a page is valid.
If a specific page has a mobile-friendly design, has mixed content or if it’s accessible.
The performance of a page for mobile and desktop devices.

If you’re agency-side, this is also a great opportunity to start the conversation about site speed auditing and educating the client on why they should invest in an audit.
If you’re looking for further advice on how to improve site speed or why it’s important, here are some useful resources:
30 tips to improve your site speed - A filterable list of the top tips to improve your site speed (created by me).
Web.dev - A Google created resource site on site speed, accessibility, and more.
WPSpeedMatters - A website dedicated to educating users on improving site speed on WordPress.
Backlink acquisition
Backlinks are an important ranking factor and can be a lot of hard work to get right. Recent studies have shown that links are still number one when it comes to Google deciding where you are going to rank.
For example, a recent study by Backlinko found that:
“The Number of Referring Domains Has a Very Strong Influence on Rankings… In fact, the number of unique referring domains was the strongest correlation in our entire study.”

So, if link building is part of your client’s SEO strategy, make sure you include information around how many links you’ve acquired for them over the past month.
Again, this highlights the value you’re providing to your clients and allows you to illustrate how link building activities contribute to traffic improvements.
Keep it as simple as you can, including critical data such as:
How many backlinks you gained for the site
The quality of the backlinks (authority sites vs. low quality)
The main tactics used
By itself, this information might not mean anything to your client, so be sure to explain how important acquiring these links are to improve the performance of the site.
If you placed a good link, maybe also highlight any referral traffic you’ve gained from it (use the referral traffic option in Google Analytics to pull out the data).
I integrated this information into the template I’ve created utilizing a Google Sheet with data validation for manual data entry and then visualized within Data Studio. Here is what it looks like:

This is a great way to visualize your link building data as you’re putting key insights into the quality and number of links achieved front and center. It’s also really easy to see at a glance, the trend of link acquisition as well as which tactics seem to be working the best.
As always, it is also a best SEO practice to include a tabular version of the data so whoever you are reporting to can see individual links achieved.
To start using the part of the report, you’ll need to make a copy of the sheet found here and then reference it when you make a copy of the data studio template, which is explained later in the article.
To make all of this data actionable, consider including recommendations regarding what you’d recommend doing next.
Have you found that you’re beginning to saturate a particular tactic? Have you spotted something a competitor is doing that you’re not? Is there an opportunity to invest more money and time in outreach?
PRO TIP
If you’re looking to try and increase the amount of investment a company has in link acquisition, one way to illustrate this is by comparing your client’s backlink profile to those of their competitors.
Once you’ve highlighted that a competitor acquires links at a higher rate than you can with the current budget, it will make it much more convincing that a higher budget is required.

If you can also really easily highlight in your reporting that you’re delivering excellent links like in the template, this is only going to make these conversations easier for you.
SEO report template
Although every SEO report for your clients should focus on their precise performance goals and requirements, it’s a good idea to use a template to help you slash the time you’d spend on admin and focus on what matters most.
With a laser focus on the facts, you could wow your clients with your achievements without overwhelming them with too much information.
I’ve created a streamlined, effective SEO report template that you can use for your client reporting that includes key metrics from Google Analytics, Google Search Console, and Advanced Web Ranking that you should include in your SEO report.
Grab your copy here. The report comes with all the Data Studio bells and whistles you’d expect, including:
Filtering options
Optional metrics
Data control
Global theming
To start making use of the report, you’ll need to simply click on the link above, select the make a copy button in the top right corner:

Then match the old data sources up with new ones that specify your data. You may also need to create some new data sources here. If you want to create some new AWR data sources, check this guide here.

If you want to use the backlink acquisition report, you’ll also need to make a copy of this sheet then create a Google Sheet data source referencing the copy you’ve made.
Be aware that the Google Analytics report is not filtered to show just the organic channel by default so that it is possible to show a complete overview of all channels.
The filter controls do make it easy to customize what you want to show for these reports, so play around with those to get it displaying what you want.
Also, on the AWR report showing your site data, there is a page-level filter that will display only your site on the report.
To edit that you will need to right-click, head into the current page settings, and edit the filter:

Summary
Creating an SEO report for your client or boss might not be the highlight of your month.
But it’s an essential way to showcase what you’ve achieved, share key performance metrics and develop your SEO strategy going forward.
You’ll demonstrate that you are providing excellent ROI, which will instill trust and value to whoever you are reporting to.